How Far Can You Trust Your Eyes on Shapes? | Illusion Lab #06
How it works
- You may see a triangle between the cut circles, but no lines or fill are drawn: the blank inside is the same color as the paper outside.
- One common explanation is that vision treats the cut circles as discs hidden behind a triangle in front, and fills in its edges and surface.
- Turn the circles so the cut edges no longer line up and the triangle fades; in the lab you can find the angle where it starts to appear.
Also calledillusory contoursKanizsa triangleEhrenstein illusionneon color spreadingtriangle that is not therewhy do I see a triangle
Video

Pressing play loads the YouTube player on this page. Watch on YouTube
Try it
Explained
In the video
- 0:00Can you see a triangle between the cut circles?
- 0:09Is the Kanizsa triangle really drawn?
- 2:01Is there a bright disc among the rays? (Ehrenstein figure)
- 3:08Does color spread between the lines? (neon color spreading)
- 4:37Why do we see what isn't drawn?
- 5:42What happens when the cut circles no longer line up?
- 6:10How can you try it yourself?
- 6:26More series from Tamelabo
The short version
Place three cut circles on a page and many people see a bright triangle between them. But no triangle is drawn: there are no edges and no fill. If you read the color of a blank spot inside the “triangle,” it is exactly the paper color (#F7F5F0), the same as a blank spot outside it.
Edges that appear where nothing is drawn are called illusory contours. Experiments have confirmed many times that vision fills in such shapes. What is still not settled is the fine detail: why the shape can look brighter than the paper, and why color can seem to spread across empty space.
On this page we use the same coordinates and drawing code as the video to test three versions of the effect: a shape (the Kanizsa triangle), brightness (the Ehrenstein figure), and color (neon color spreading). People see these differently, and not seeing them is perfectly normal.
Do you see a triangle?
Before reading on, just look at the figure below. It contains three black circles, each with a slice cut out.
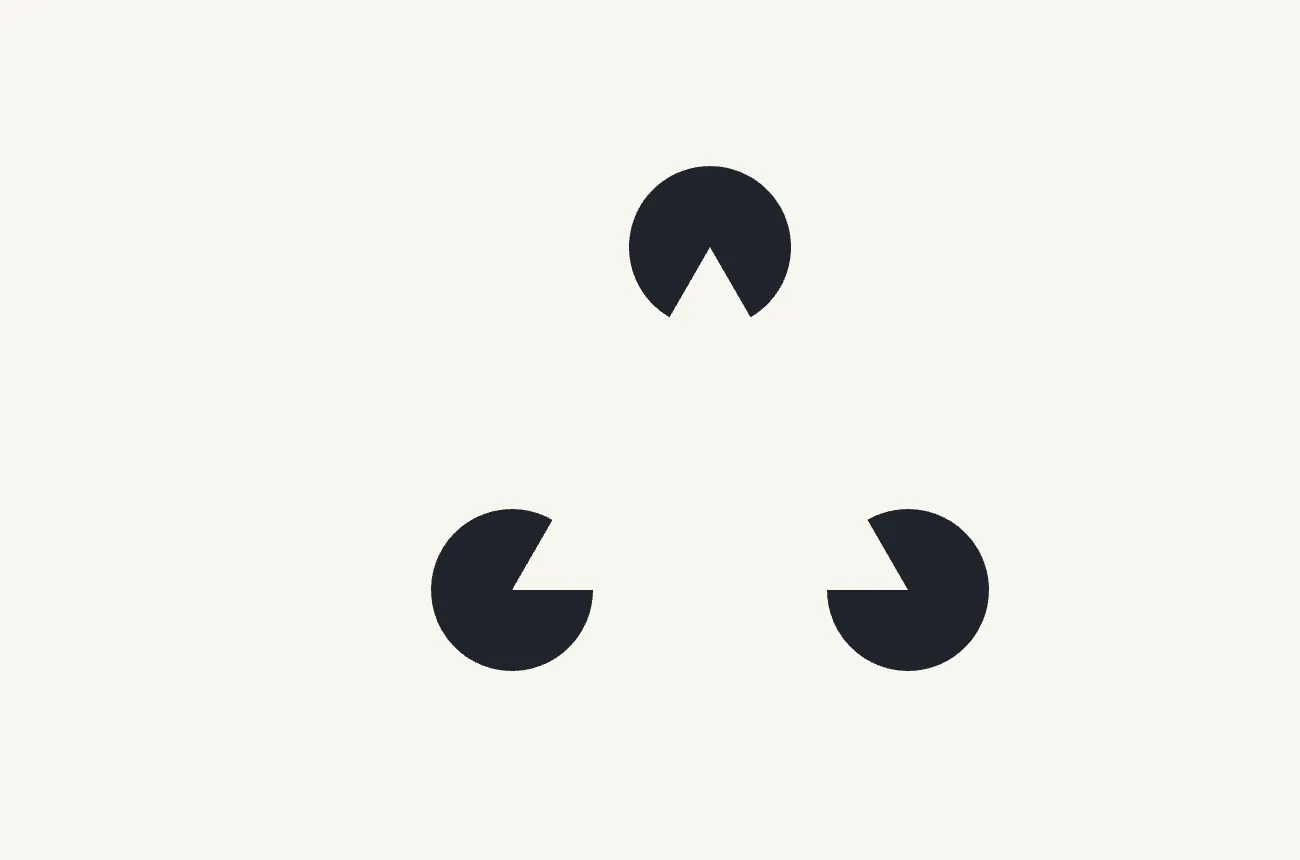
Many people see a pale triangle sitting on top, its edges running across the empty gaps between the circles. Some say the inside looks slightly brighter than the paper; others see the edges but no brightness; some see nothing at all. All of these are fine.
Checking it: the triangle is not drawn
How the figure is built
Every figure here is drawn on a 1000 × 1000 stage. The unit, u, is a diagram unit, not a screen pixel.
| Item | Value |
|---|---|
| Circle centers (the triangle’s corners) | (500, 219), (280, 600), (720, 600) |
| Circle radius | 90 u |
| Side lengths | 439.96 u, 440 u, 439.96 u |
| Angle of each cut | Equal to the corner’s angle (59.997°–60.007°) |
| Part of each side that is a real cut edge | 90 u at each end |
| Part of each side with nothing drawn | about 260 u |
Each cut points exactly toward the neighboring corner, so the two cut edges at either end of a side lie on the same straight line (zero offset in the calculation).
There is no line between the cut edges
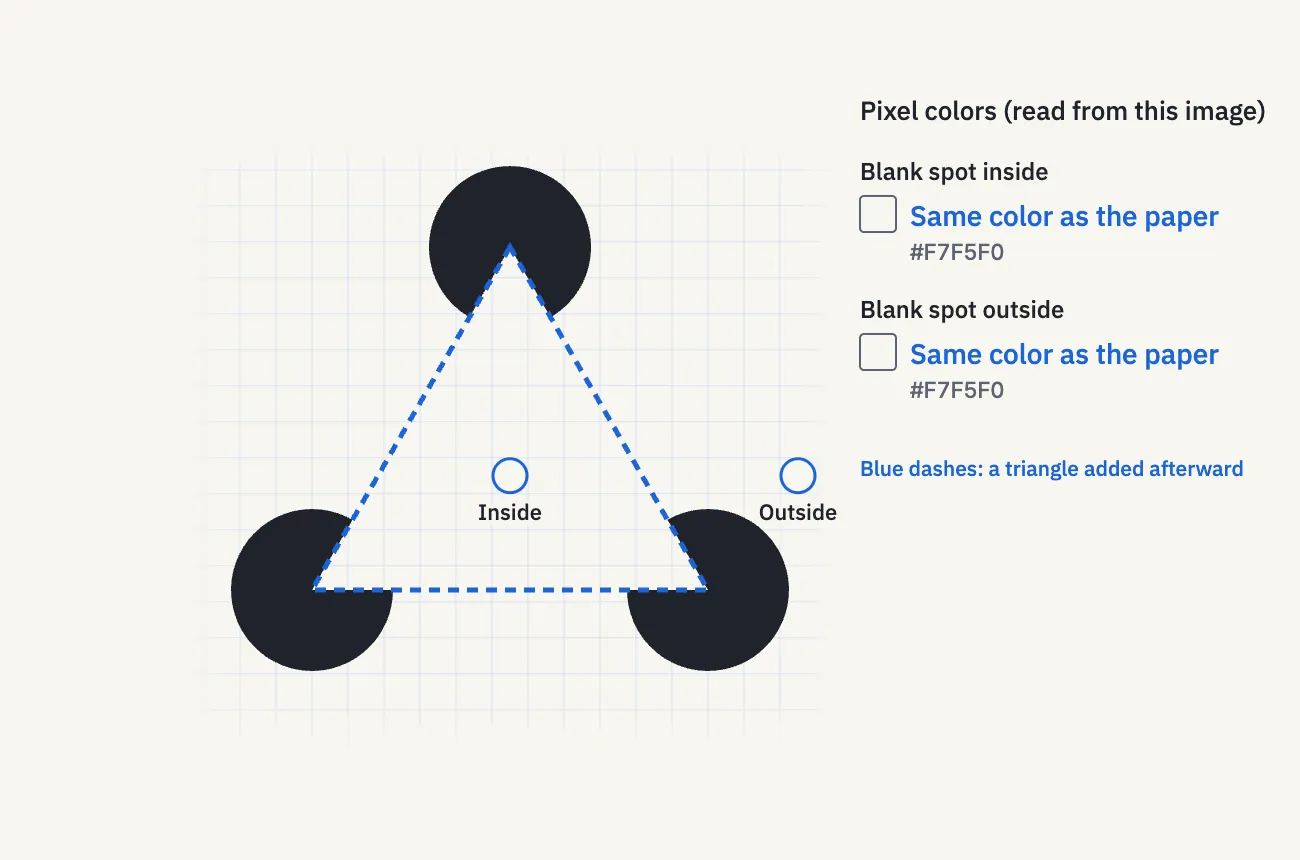
Here the figure is overlaid with a real triangle, drawn as a blue dashed line that we added afterward. In the original figure, the only edges along each side are the two 90 u cut edges at its ends. The roughly 260 u between them contains no line and no boundary.
Blank spots are the paper color
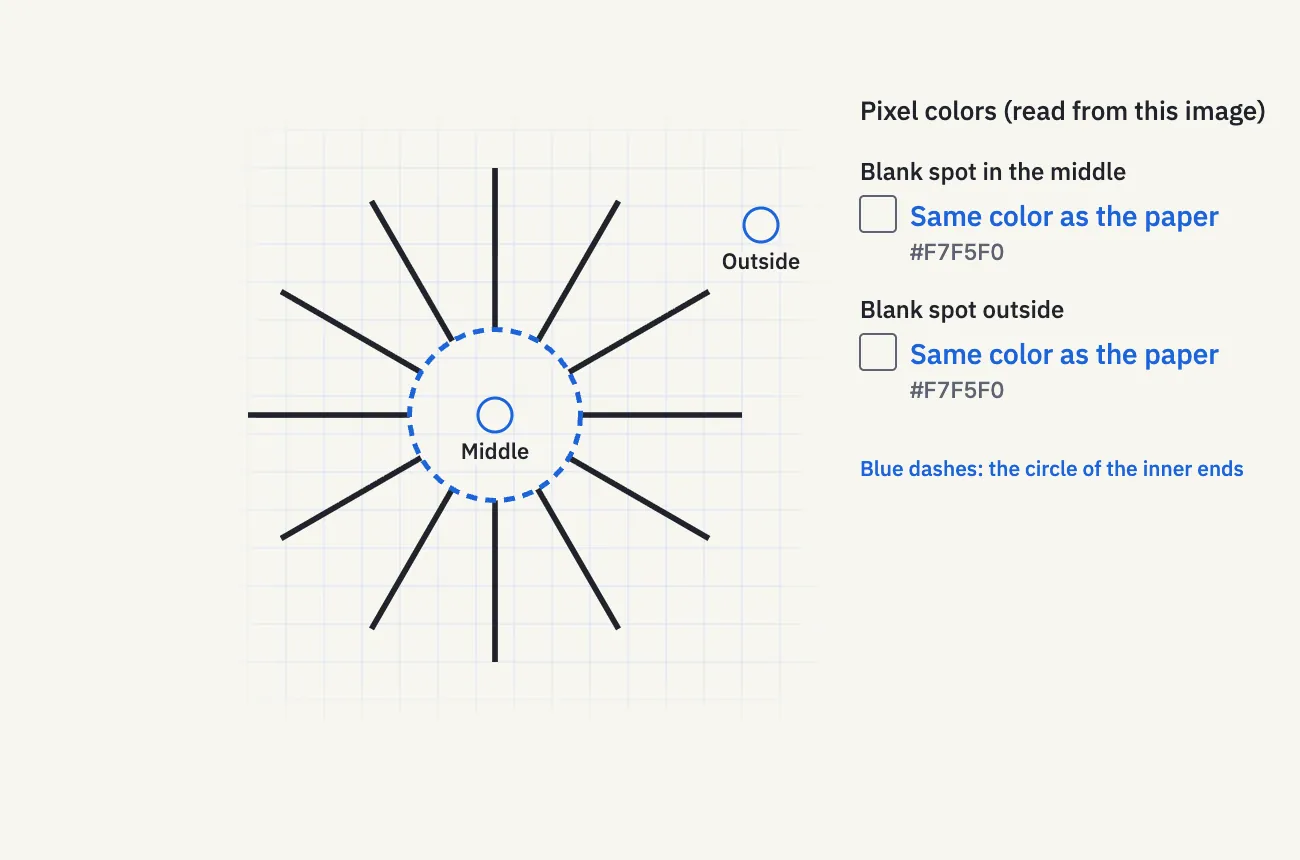
A picture on a screen is made of tiny dots of color (pixels). We picked points away from the circles, edges and grid lines, and read their colors. The blue marker rings are drawn slightly away from each point so they don’t cover it.
- Blank spot inside the triangle (stage point (500, 473), the triangle’s center): #F7F5F0, the paper color
- Blank spot outside the triangle (stage point (820, 473)): #F7F5F0, the paper color
The values printed in the figure were read from that very image, and the same two points are paper-colored in the rendered video too. What this shows is that the chosen blank points have the same color. It does not mean every point is paper-colored: points on the circles are ink (#20232A), and the rim of each circle has pixels that mix ink and paper.
Turn the circles
Now the same circles are turned outward in place. Their shape, size and cut angle are unchanged; only their direction is different.
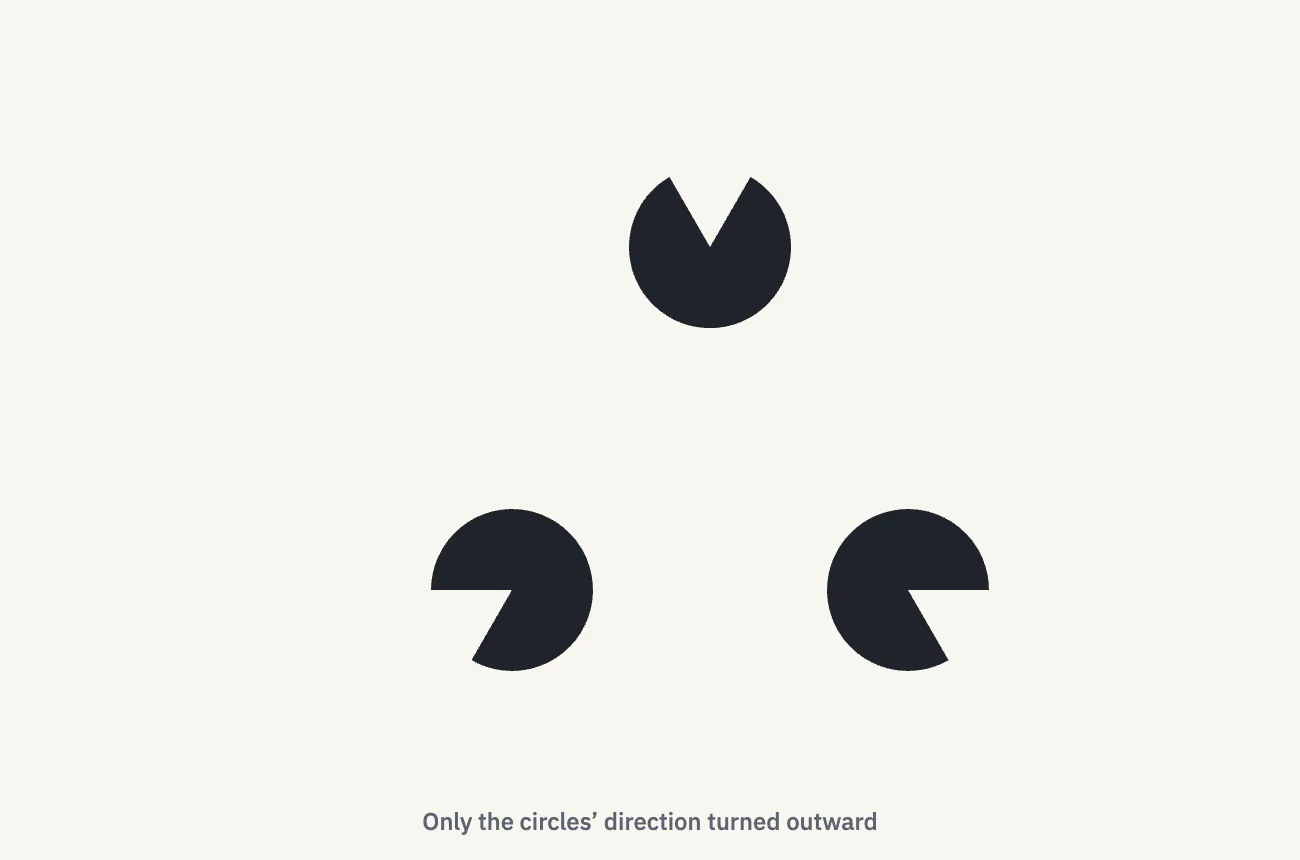
For most people, the triangle disappears. Researchers use exactly this comparison, inward-facing versus turned circles, as a basic control when studying illusory contours.
Names: the Kanizsa triangle and illusory contours
This figure is known as the Kanizsa triangle, after the Italian psychologist Gaetano Kanizsa, who made it famous in 1955.
The broader effect, seeing edges and surfaces where nothing is drawn, is called illusory contours (also “subjective contours”). It was first reported by the German psychologist Friedrich Schumann in 1900. In the Kanizsa figure, two kinds of filling-in are usually described together: the visible triangle’s edges are completed (modal completion), and each cut circle is completed as a whole disc hidden behind the triangle (amodal completion).
It happens with brightness: the Ehrenstein figure
Next, twelve lines spread out like rays. Their inner ends all sit on a circle of radius 90 u (each line is 170 u long and 6 u wide).
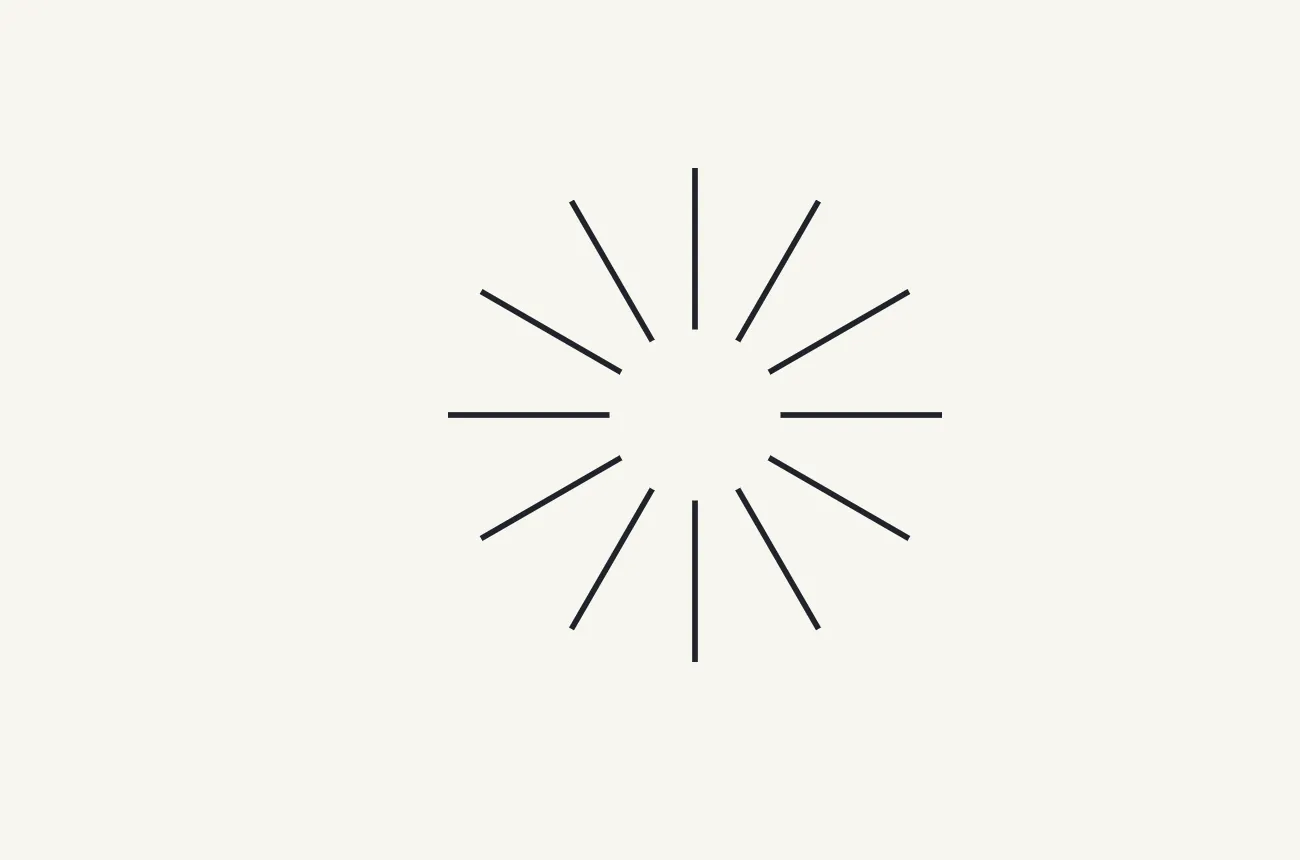
Many people see a disc in the middle that looks slightly brighter than the paper. This is the Ehrenstein figure, reported by Walter Ehrenstein in 1941 (and discussed again in his 1954 book). He introduced it as a variation on another illusion, the Hermann grid.
When we read the colors, the blank middle and a blank point outside are both the paper color. The blue dashed circle marks where the inner ends line up.
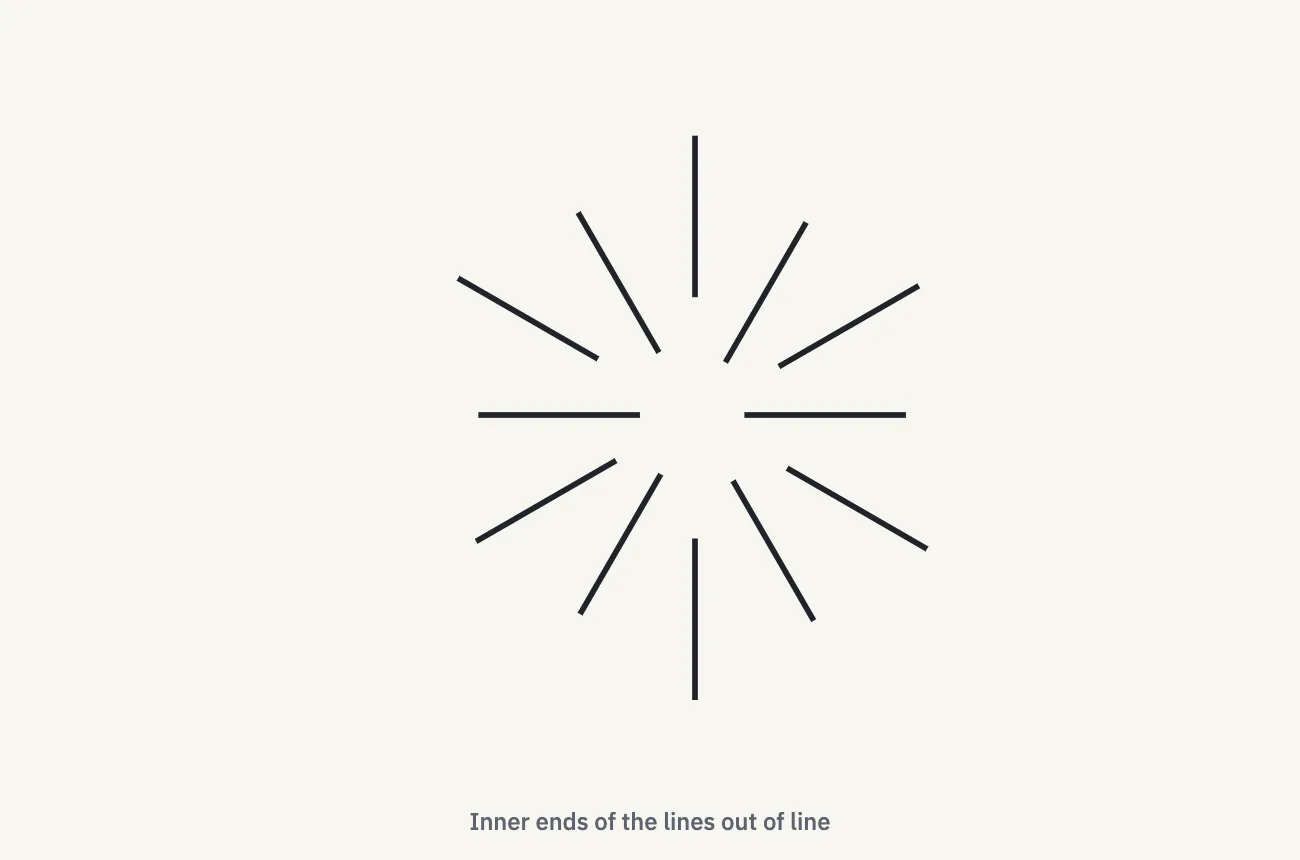
Move each line in or out so the inner ends no longer line up, and the bright disc tends to fade or disappear (the lines keep their length).
Another classic check is to draw a real thin ring where the disc’s edge appears. Studies report that this tends to weaken the brightness rather than strengthen it. In the lab you can switch on a 3 u ink ring on the circle of the inner ends.
It happens with color: neon color spreading
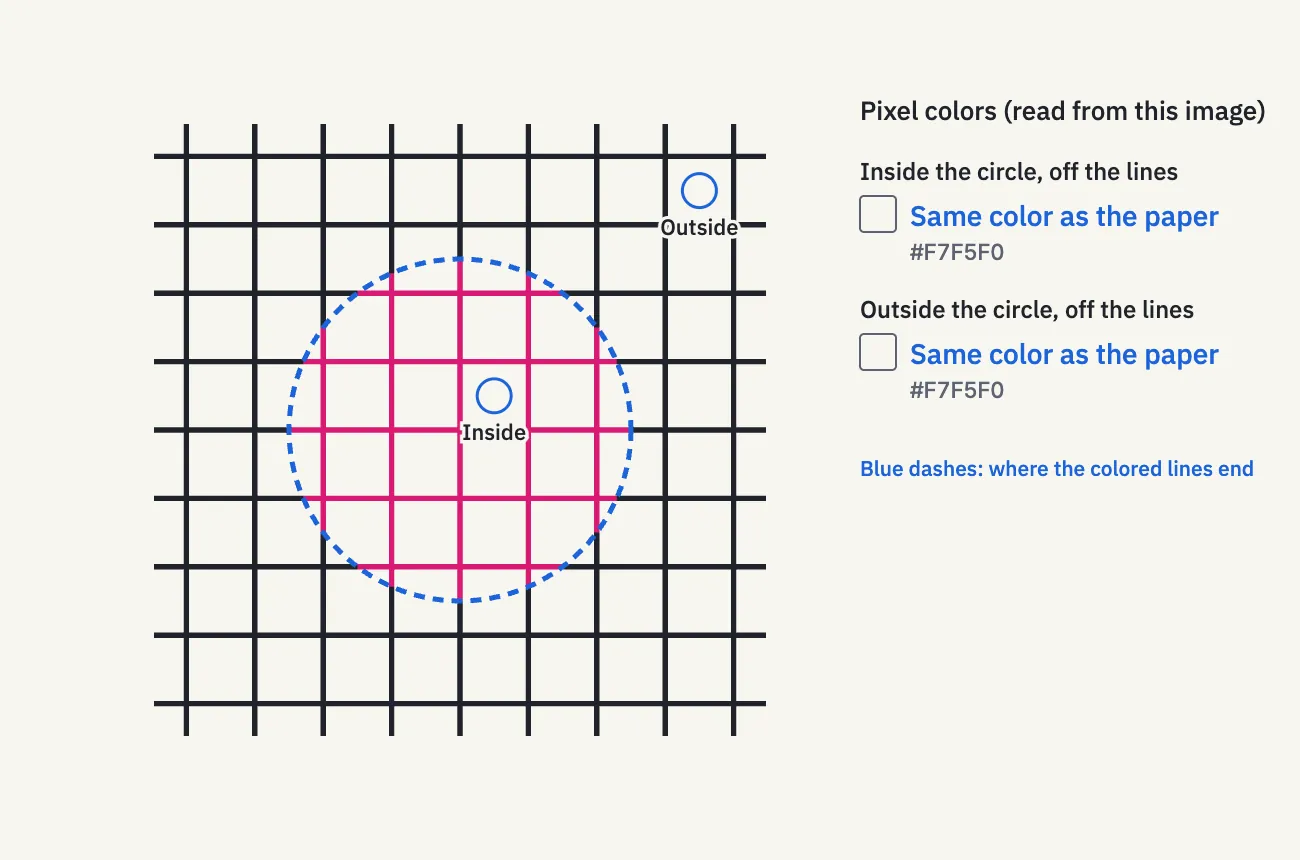
Finally, a grid of ink lines, 76 u apart and 6 u wide. Inside a central circle of radius 190 u, only the line segments are recolored magenta (#D81B74). The shape, width and position of the lines are unchanged. Every boundary between a colored and an ink segment sits exactly on that circle, with no gap.
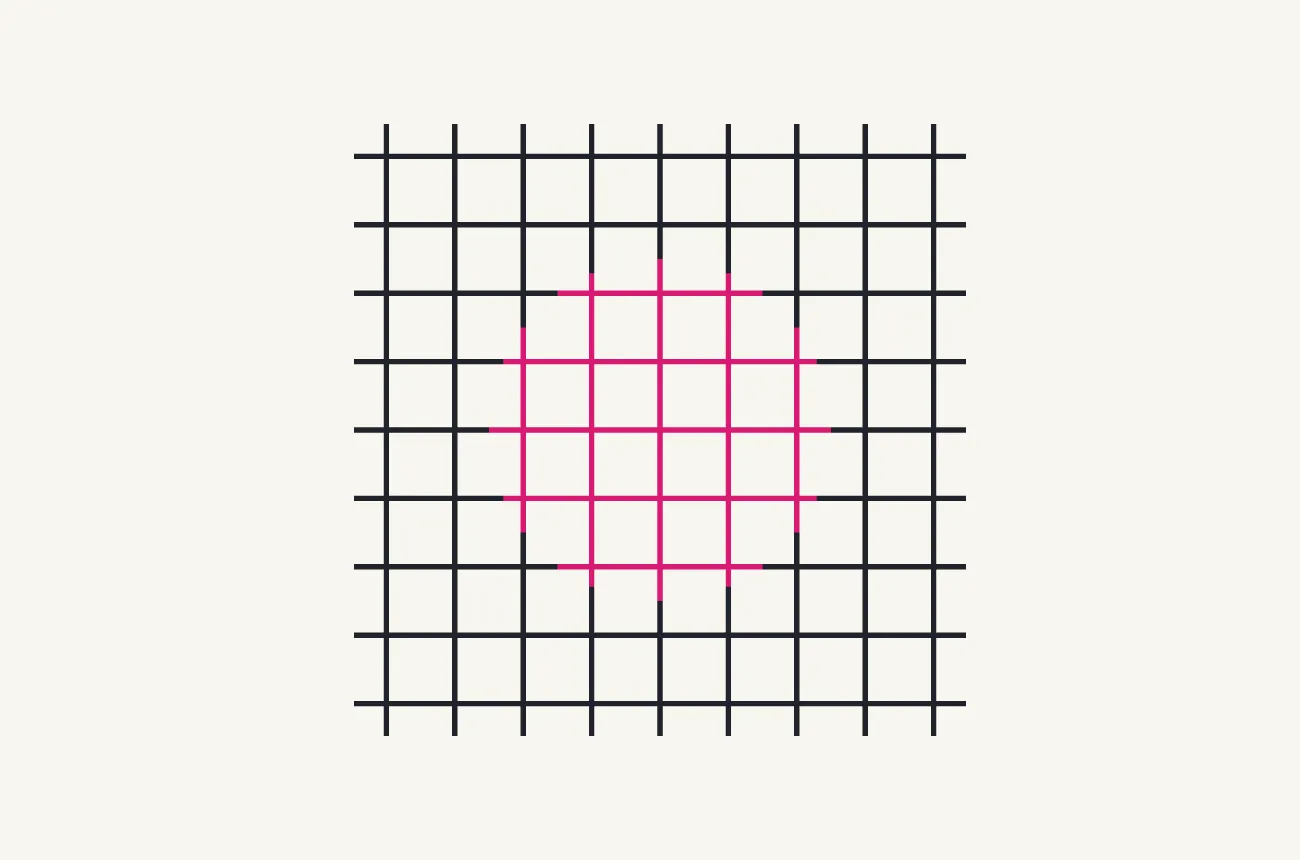
Many people see a faint, transparent veil of color spreading over the unpainted paper between the lines. This is neon color spreading. It was documented by Varin in 1971 and reported by van Tuijl in 1975 as “neonlike color spreading.”
When we read the colors, a point inside the circle that is off the lines, and a point outside the circle, are both the paper color. The color exists only on the lines. The blue dashed circle shows where the colored segments end; the spreading color is seen roughly inside it.
Now shift the colored segments at right angles to their lines: the colored parts of vertical lines move sideways, and those of horizontal lines move up or down. The figure below shows a 14 u shift.
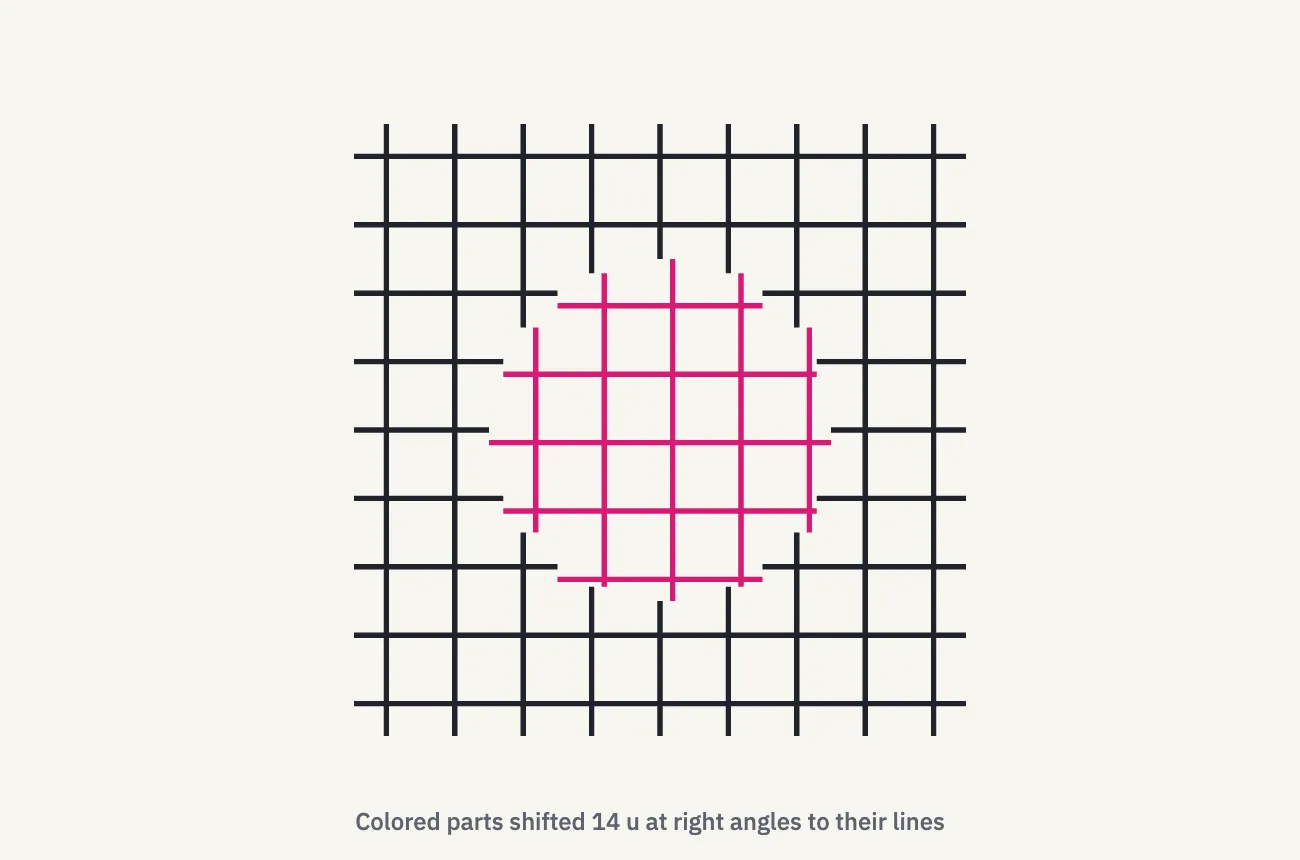
When the colored segments continue the ink lines in a straight line, the veil is easiest to see. The more you shift them, the weaker it tends to get, and for some people and some amounts it disappears. We don’t claim that a straight-line connection is strictly required, or that it vanishes at a particular number of units. Some studies also report that different colors spread differently; here we use a single color.
Why do we see it?
We keep what has been confirmed separate from the hypotheses.
What has been confirmed
- Seeing edges where none are drawn has been confirmed again and again by comparing these figures with misaligned versions, such as the turned circles.
- In monkeys, nerve cells in visual area V2 respond at the location of an edge that isn’t there (von der Heydt, Peterhans & Baumgartner, 1984).
- Responses in the earlier area V1 have also been reported (Grosof, Shapley & Hawken, 1993), so which stage of the brain produces these edges is not settled.
A common explanation (hypothesis)
A widely used explanation treats the figure as a scene in which something in front hides something behind. If vision takes the cut circles to be whole discs partly covered by a triangular sheet, then the missing edges and surface of that sheet are filled in to fit the scene. This matches how the cut circles look like discs tucked behind a triangle.
Conflicting evidence and open questions
Some accounts explain the extra brightness as brightness contrast, an exaggeration of differences from the surroundings. Others argue that contrast alone cannot explain it, and researchers disagree on whether filling in edges and filling in brightness are the same process.
For neon color spreading, too, some accounts relate it to seeing a transparent colored layer, while others model it as the color signal spreading past a boundary.
In short, it is clear that vision fills in shapes. How brightness and color spread, in detail, is still not known.
What changes the effect?
- The effect is known to weaken as the proportion of each side that is a real edge (the support ratio) gets smaller. For the triangle here it is 2 × 90 ÷ 440 ≈ 0.41.
- Shrinking the circles to a radius of 60 u lowers it to about 0.27. In the lab you can measure with these smaller circles too.
- As you turn the circles a little at a time, the triangle appears or vanishes at some point. That angle differs from person to person and from screen to screen.
Frequently asked questions
Is it a problem if I can’t see it?
No. How strongly people see illusory contours varies, and it can change for the same person with the size of the figure or the viewing distance. The lab records how your view matched under one set of conditions; it does not test eyesight or ability.
Isn’t the inside of the triangle whiter?
No. Read straight from the image, a blank point inside and a blank point outside are both #F7F5F0 (red 247, green 245, blue 240). The extra whiteness or brightness happens in perception, not in the picture.
Isn’t the spreading color just the screen bleeding?
No. The specified points off the lines, inside and outside the circle, are both the paper color. Colored pixels exist only on the lines (and in the mixed pixels along their edges). Also, when the colored segments are shifted at right angles, the amount of color in the picture stays the same but the veil weakens. If it were only bleeding, shifting wouldn’t matter.
Is the triangle equilateral?
Because the corners use whole-number coordinates, the sides differ by less than 0.05 u, so we simply call it a triangle. The difference is far too small to affect what you see.
Try it in the lab
Open “Illusion Lab #06 — Shape experiments” from the link in the video description.
- Experiment 1 (Kanizsa triangle): change the direction and size of the circles, cover them with paper-colored covers, and check the color of any point. You can also run a 6-round task: turn the circles and match the angle where the triangle just appears. If you can’t find it, answer “I could not see it” or “I could not decide the point” and move on.
- Experiment 2 (Ehrenstein figure): change the number of lines and how far their ends are out of line, and switch on a thin ink ring or a blue dashed circle.
- Experiment 3 (neon color spreading): shift the colored segments and change the size of the recolored circle.
People see these differently. The task is not a diagnosis; it records the angle where the triangle appeared for you under those conditions. Records stay on your device and are never sent anywhere.
Sources
Where the facts and numbers in the video and on this page come from.
References
- Schumann, F. (1900). Beiträge zur Analyse der Gesichtswahrnehmungen. Erste Abhandlung. Zeitschrift für Psychologie und Physiologie der Sinnesorgane, 23, 1–32.
- Kanizsa, G. (1955). Margini quasi-percettivi in campi con stimolazione omogenea. Rivista di Psicologia, 49, 7–30.
- Ehrenstein, W. (1941). Über Abwandlungen der L. Hermannschen Helligkeitserscheinung. Zeitschrift für Psychologie, 150, 83–91.
- Varin, D. (1971). A paper in Italian, cited in later work as an earlier report of neon color spreading than van Tuijl’s.
- van Tuijl, H. F. J. M. (1975). A new visual illusion: neonlike color spreading and complementary color induction between subjective contours. Acta Psychologica, 39, 441–445.
- Figure coordinates and calculations: Tamelabo (every figure on this page is exported from the same design data and drawing code as the video)
Links
- Dresp-Langley, B. (2009). The Ehrenstein illusion. Scholarpedia, 4(10), 5364.hal.science/hal-01054030
- Pinna, B. & Grossberg, S. (2005). The watercolor illusion and neon color spreading: a unified analysis of new cases and neural mechanisms. Journal of the Optical Society of America A, 22(10), 2207–2221.doi.org/10.1364/JOSAA.22.002207
- von der Heydt, R., Peterhans, E. & Baumgartner, G. (1984). Illusory contours and cortical neuron responses. Science, 224, 1260–1262.doi.org/10.1126/science.6539501
- Grosof, D. H., Shapley, R. M. & Hawken, M. J. (1993). Macaque V1 neurons can signal ‘illusory’ contours. Nature, 365, 550–552.nature.com/articles/365550a0
- Yankelovich, A. & Spitzer, H. (2019). Predicting Illusory Contours Without Extracting Special Image Features. Frontiers in Computational Neuroscience, 12, 106.pmc.ncbi.nlm.nih.gov/articles/PMC6345704
- Illusory contour (Wikipedia).en.wikipedia.org/wiki/Illusory_contour
- Neon color spreading (Wikipedia).en.wikipedia.org/wiki/Neon_color_spreading
Voice, music, art
- Music (OpenTracks): “さみしいおばけと東京の月” by しゃろう / “日曜の午後” by KK. Used under the OpenTracks terms of use.
- Sound effects: Kenney “Interface Sounds” (click_001, tick_002, confirmation_001, select_001; CC0) https://kenney.nl/assets/interface-sounds . The turning “swoosh” and the room tone were synthesized in code.
- Fonts: IBM Plex Sans JP, IBM Plex Sans, Inter, M PLUS Rounded 1c ExtraBold (SIL Open Font License 1.1).