How Far Can You Trust Your Eyes on Length? | Illusion Lab #01
How it works
- Equal lines look unequal under the Müller-Lyer, vertical-horizontal, and Ponzo illusions.
- The "same length" lines are drawn exactly the same — cues like orientation and depth change how long they look.
- A blue ruler breaks each illusion, so you can check the true lengths yourself.
Video

Pressing play loads the YouTube player on this page. Watch on YouTube
Try it
Explained
In the video
- 0:00Which line is longer, the top or the bottom?
- 0:42The Müller-Lyer illusion — why do equal lines look different?
- 1:27The pause experiment — which step is truly the same length?
- 2:44The vertical-horizontal illusion — which is really longer?
- 4:20The Ponzo illusion — why does depth change length?
- 6:05So how far can you trust your eyes on length?
Which line is longer, the top or the bottom?
Illusion Lab is a series where we see an illusion, break it, and check it with your own eyes. Episode 1 is about length.
The Müller-Lyer, vertical-horizontal, and Ponzo illusions let us ask two different questions: Are these lines physically equal? And why might they look unequal? We can settle the first with coordinates and an overlay. The second is still a research question. Try the figures first, then follow the blue guides and the evidence.
The Müller-Lyer illusion: compare the shafts, then check the ends
Look at the two horizontal lines below. Compare the distance between the vertices at their ends, rather than the full width of each drawing. We'll call the horizontal line the shaft and the slanted lines the fins.
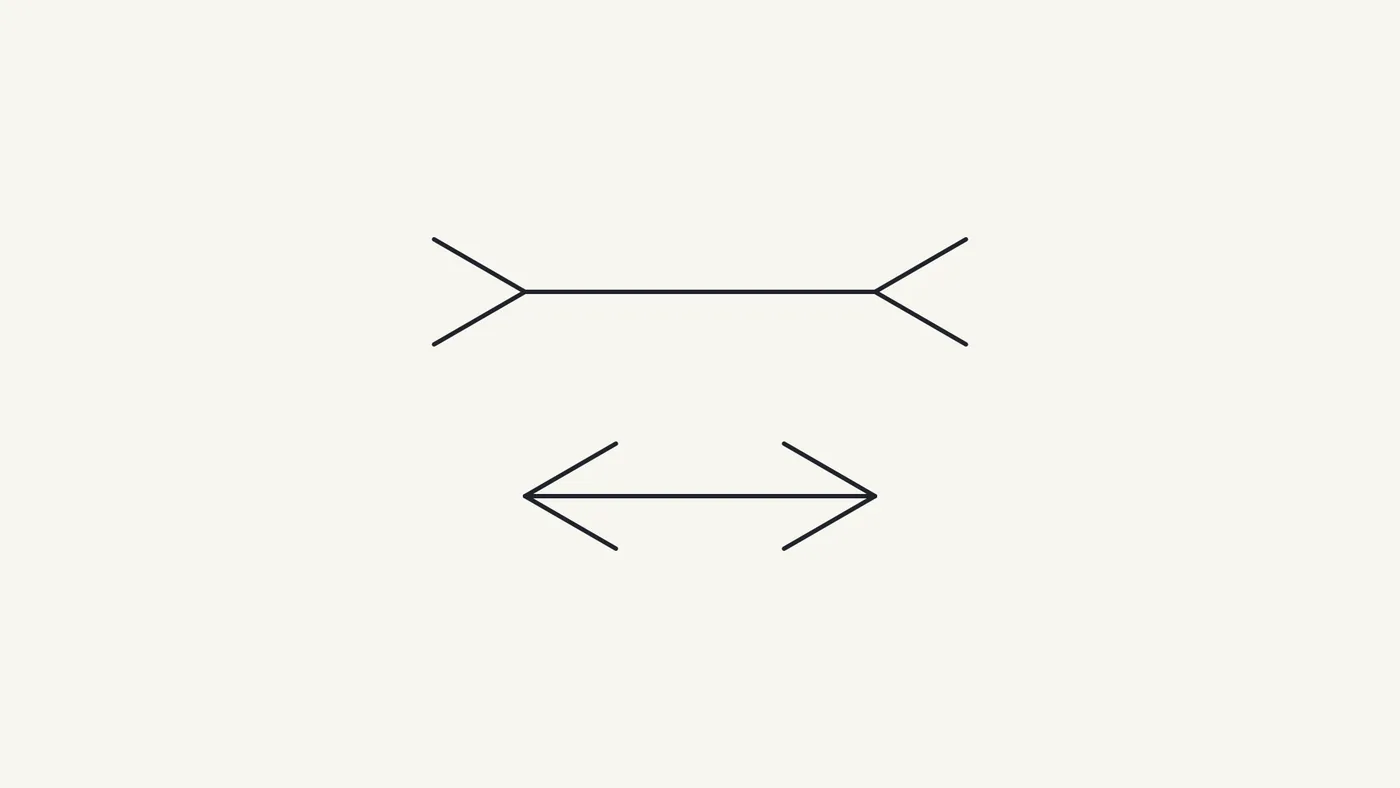
Does the upper shaft look longer? If they look equal, keep that answer too. There is no required way to see the figure.
What the blue guides establish
Both shafts are 480 px long. Each fin is 144 px long. In the check image, the dashed blue guides pass through the endpoints of both shafts. Reversing the fins doesn't move those endpoints.
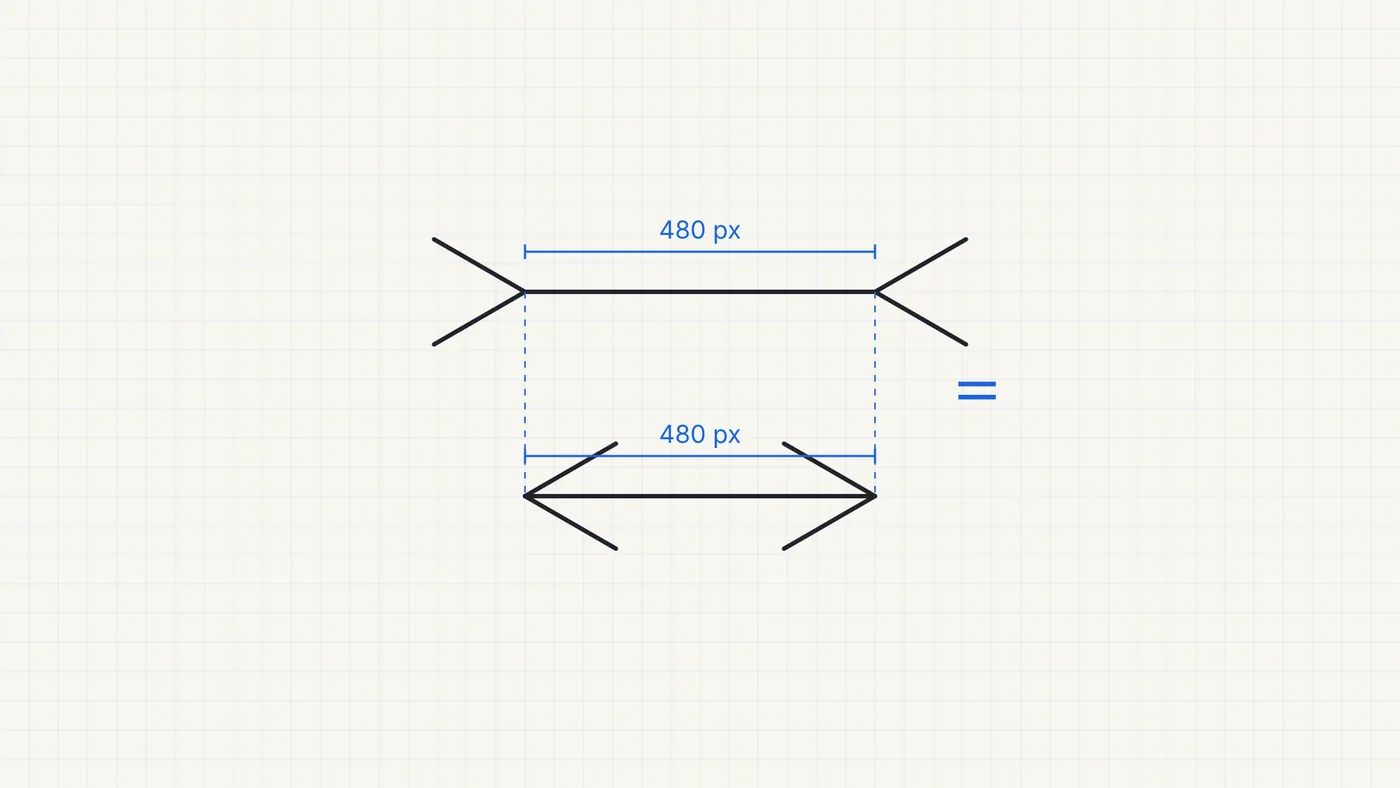
These images use the video's drawing code and coordinates. Pixel measurements refer to the original 1920 × 1080 images; your browser scales the whole figure to fit the page. They are not counts of the pixels currently visible on your screen. Geometric lengths are measured between the endpoints of a line's centerline.
F. C. Müller-Lyer reported the illusion in 1889. Dewar's 1967 paper lists that original publication in its references.
Why does the Müller-Lyer illusion happen?
One influential explanation, discussed by Gregory (1963), treats the figures as cues to three-dimensional corners: an inside corner of a room or the outside corner of a building. On this account, interpreting depth contributes to the judgment of length even though the drawing is flat.
Another explanation focuses on where the endpoints appear to be. Nearby fins may pull the apparent endpoint toward their tips. Rather than locating an isolated vertex, vision may use a position influenced by the surrounding shape. Pressey and Martin (1990) studied how fin angle and length affect apparent position. Valerjev and Dujmović (2024) measured errors in locating angle vertices and discussed them in relation to this kind of account.
There are useful limits to both stories. Howe and Purves (2005) describe versions with squares or dots instead of fins, and versions with no shaft at all, that produce an illusion in the same direction. Recognizable room corners cannot be the whole explanation for that family of figures. They also discuss evidence that the illusion remains without eye movements, which challenges older explanations based on eye movements alone.
An effect of the surrounding shape is an observation. A proposed mechanism for that effect is a hypothesis. Researchers have not yet established how far each explanation applies.
What changes when you turn, shorten, or recolor the fins?
Turn both sets of fins to a right angle to their shafts, and the two drawings become identical apart from position. In the figure below, a blue copy of the upper drawing has been translated onto the lower one. The difference in fin geometry has disappeared.
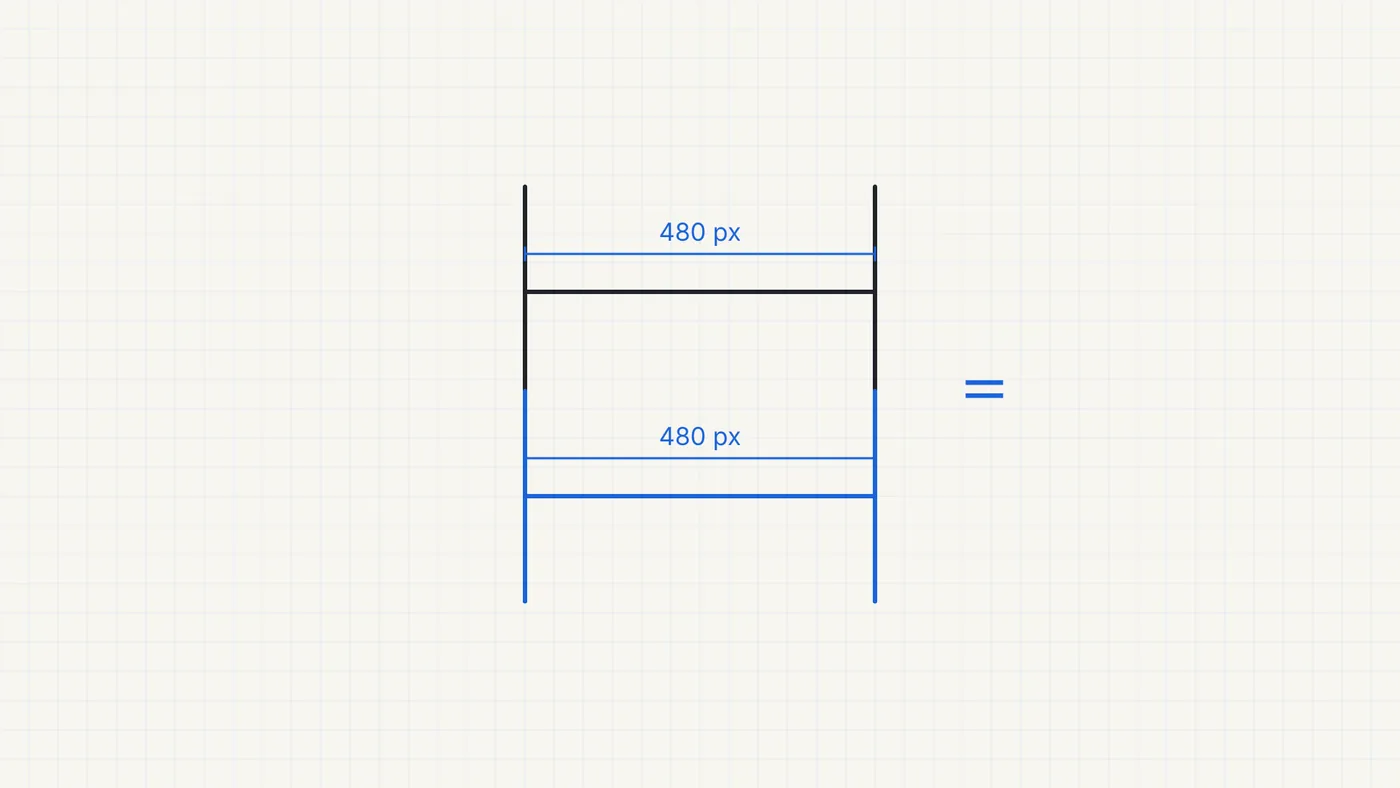
Dewar (1967) found a tendency toward larger illusions with sharper fin angles and longer fins, with a diminishing increase at longer fin lengths. His angle was the angle between the two fins. The lab bench's angle is measured between a fin and the shaft, so those angle values should not be treated as interchangeable.
Miyahara (2006) found a weaker illusion when shaft and fins had different colors. On the lab bench, you can change angle, length, color, and whether the shaft is visible. Change one setting at a time, then restore it and compare your impressions.
Reading your letter from the pause experiment
The pause experiment deliberately uses unequal shafts at most steps. The lower shaft stays at 480 px while the upper one gets shorter in 16 px steps. D is the only physically equal step.
| Letter | Upper shaft (px) | Difference from lower shaft, approximately, rounded to whole percent |
|---|---|---|
| A | 528 | +10% |
| B | 512 | +7% |
| C | 496 | +3% |
| D | 480 | 0% |
| E | 464 | −3% |
| F | 448 | −7% |
| G | 432 | −10% |
| H | 416 | −13% |
| I | 400 | −17% |
| J | 384 | −20% |
| K | 368 | −23% |
| L | 352 | −27% |
| M | 336 | −30% |
The calculation is (upper shaft − 480) ÷ 480 × 100. At G, the upper shaft is 48 px shorter: exactly 10% below the reference. If G looked equal to you, a physically shorter shaft matched the other shaft in your perception under those conditions.
This is a table of the lengths we presented, not a table of average human performance. A letter records your response to this particular figure. It does not establish a fixed percentage error for your vision across other situations.
The vertical-horizontal illusion: orientation is only part of the story
Compare the upright line with the whole horizontal line in this inverted T.
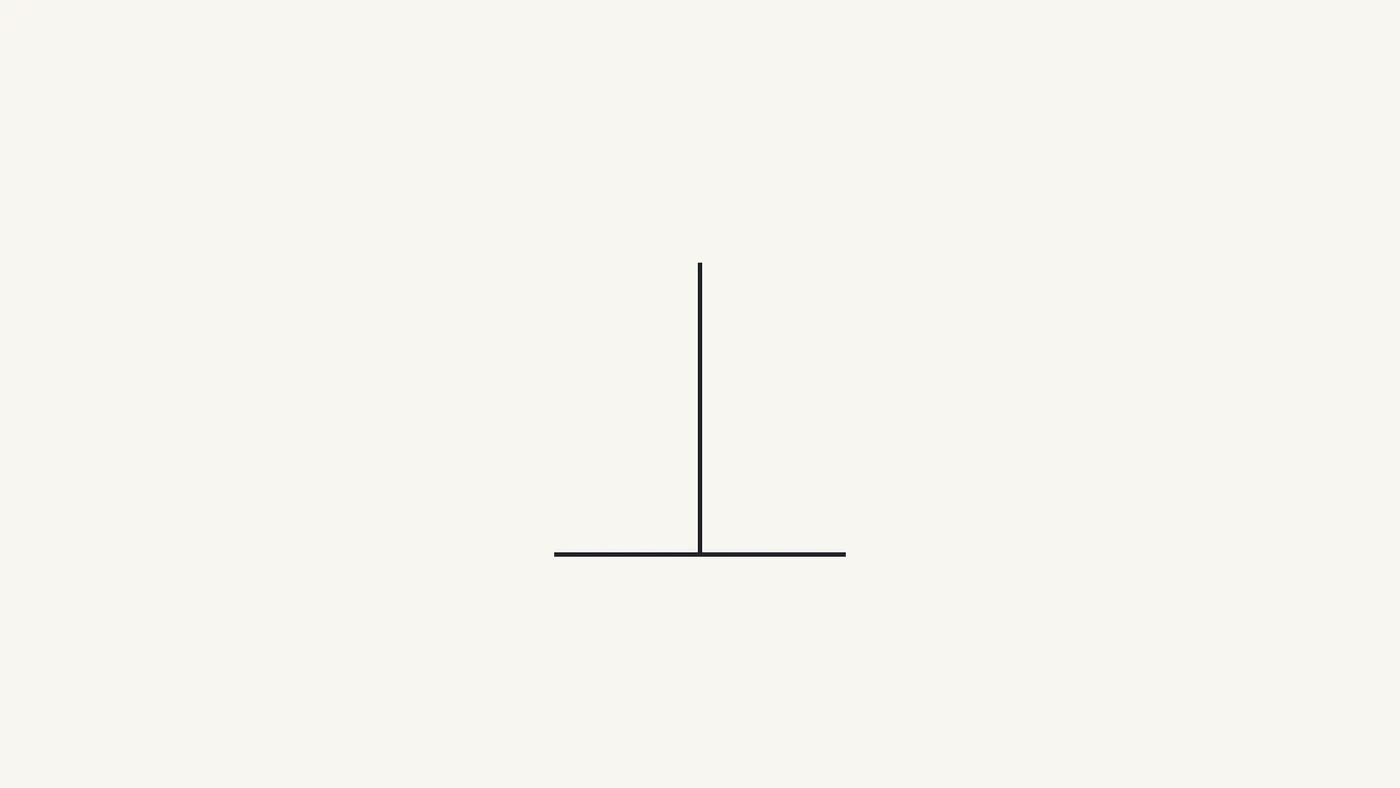
Many people see the upright line as longer. Both are 400 px long. Rotate the upright line 90° around its lower endpoint and translate it 200 px to the left, and its endpoints match the horizontal line. The dashed blue copy below shows that overlay; no resizing is involved.
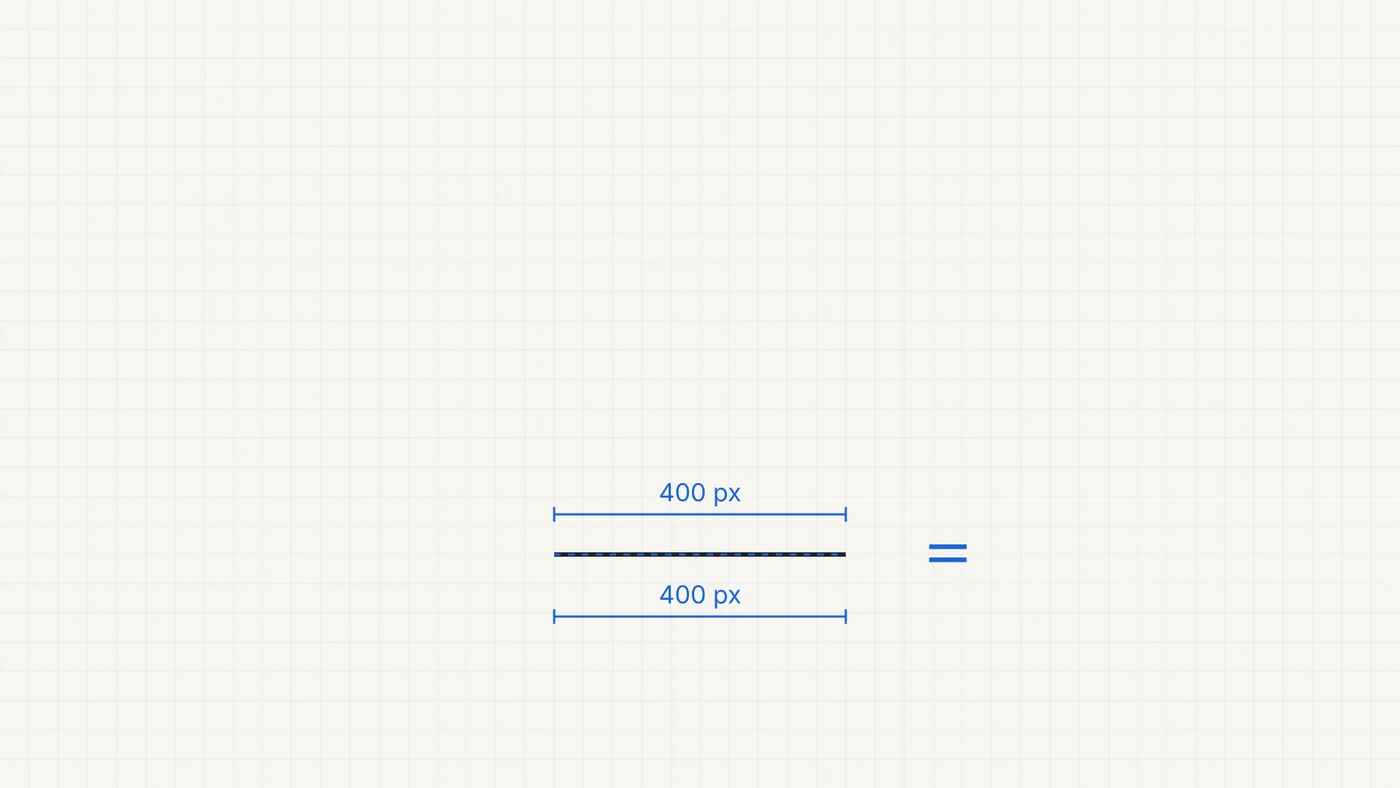
Turn the whole T sideways
If “vertical looks longer” were enough to explain the T, what would happen when the entire drawing turned sideways? Now compare the line projecting to the right with the whole vertical line.
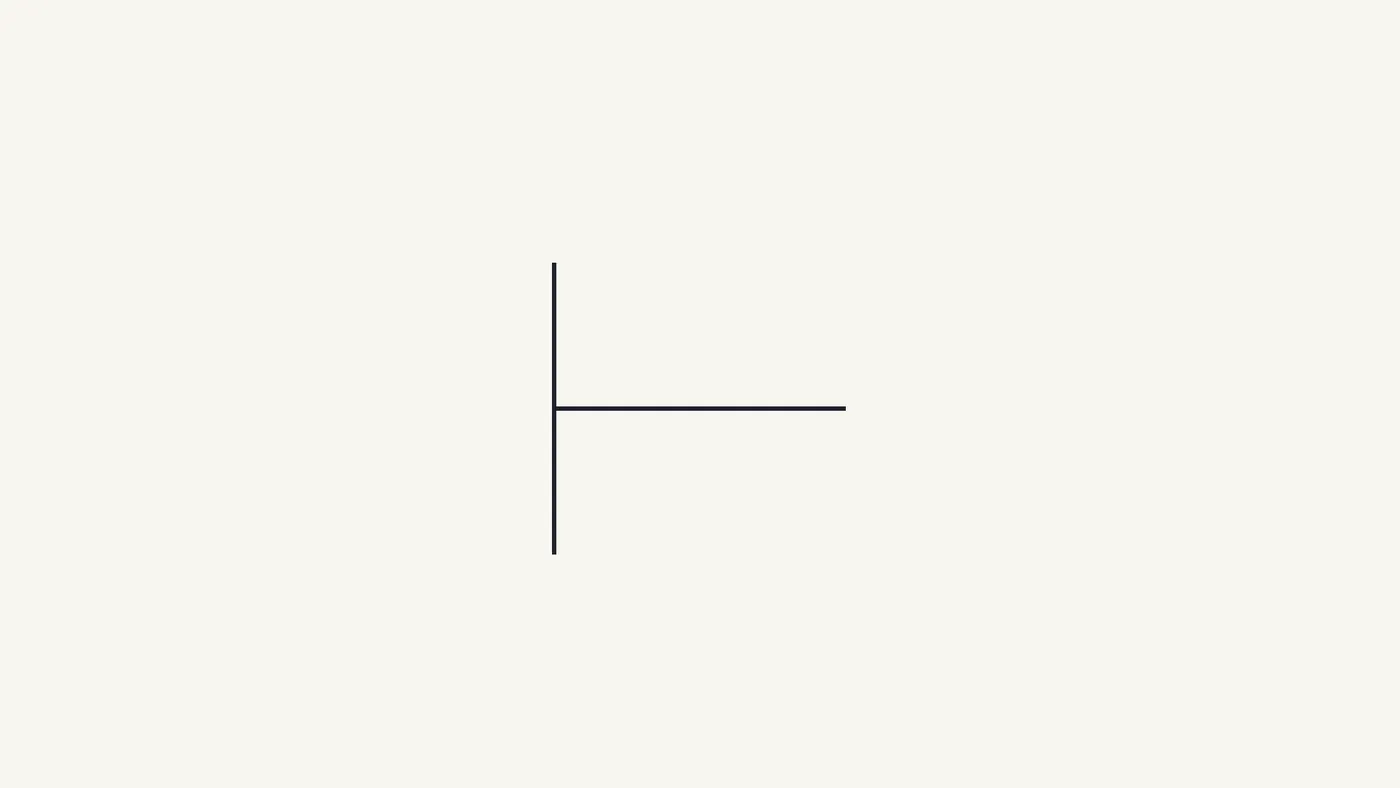
Mamassian and de Montalembert (2010) found that the projecting line can still look longer in this orientation. Chouinard and colleagues (2017) also found an illusion in the rotated figures. How the lines meet matters alongside their orientation.
Mamassian and de Montalembert separated an orientation effect from a bisection effect: one line divides the other into two parts. Mikellidou and Thompson (2013) proposed separating that second effect into contributions from a line ending against another and from lines crossing. These accounts divide the same visible arrangement into different components.
Studies estimate an orientation difference of roughly 6–7%, including evidence from separated lines. That is an estimate under research conditions. It is not a physical difference in our T, or a prediction that every reader will experience a 6–7% illusion.
Could the visual field act as a frame?
The framing account associated with Künnapas draws attention to the horizontally extended area visible with both eyes. Within that area, a vertical line reaches closer to the boundary than an equal horizontal line, potentially making it look longer. Künnapas's 1957 work on surrounding frames is discussed by Chouinard and colleagues (2017).
Prinzmetal and Gettleman (1993) reported a smaller illusion with one eye than with two. Studies finding a weaker illusion within a tall frame than a wide frame also support a role for framing. But this does not settle the effects of the T-shaped junction. How best to combine orientation and junction effects remains unresolved.
The Ponzo illusion: equal on the page, different in a hallway
Compare the bars between the converging rail-like lines. Does the upper bar look longer? This arrangement is known as the Ponzo illusion, named for Ponzo. For its early literature, Yildiz and colleagues' 2022 review cites Ponzo (1910).
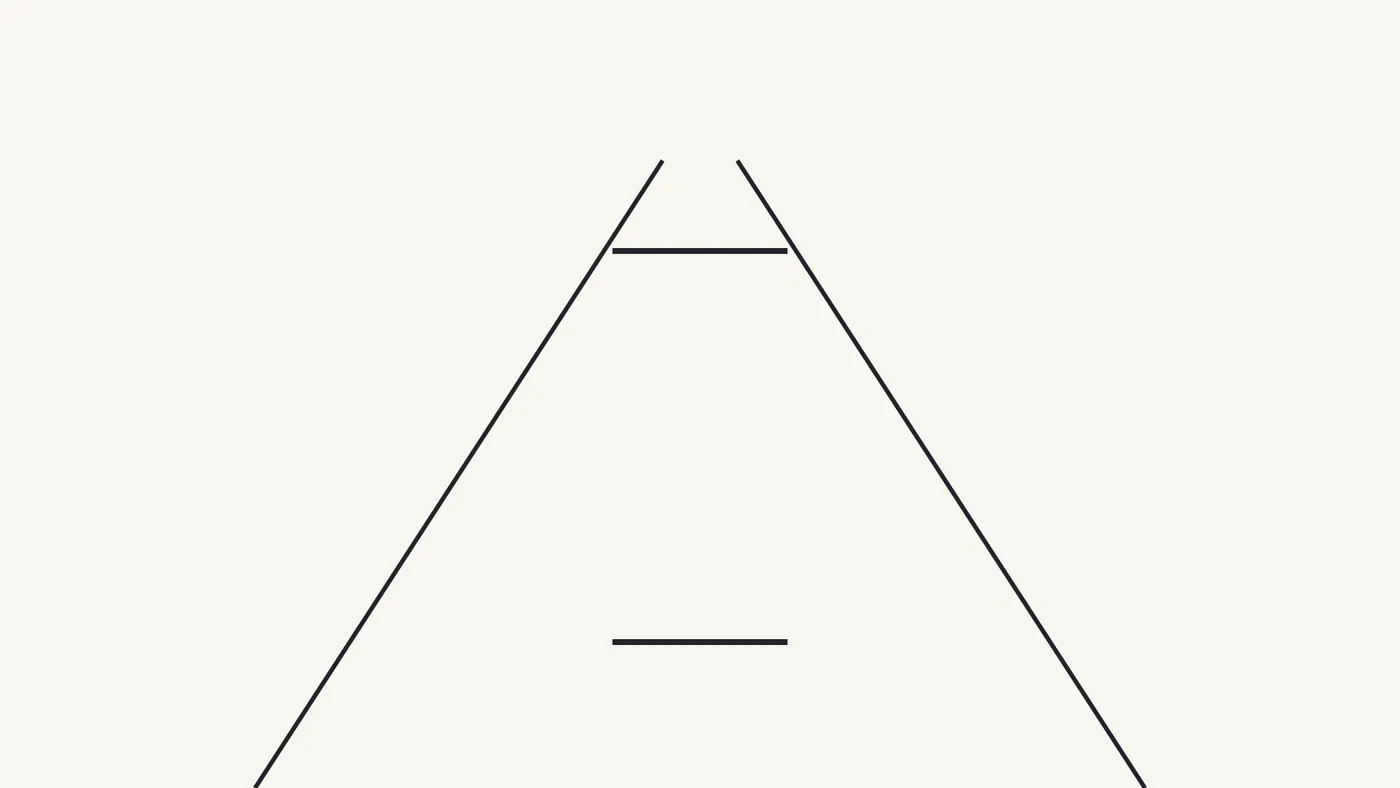
Remove the surroundings and check
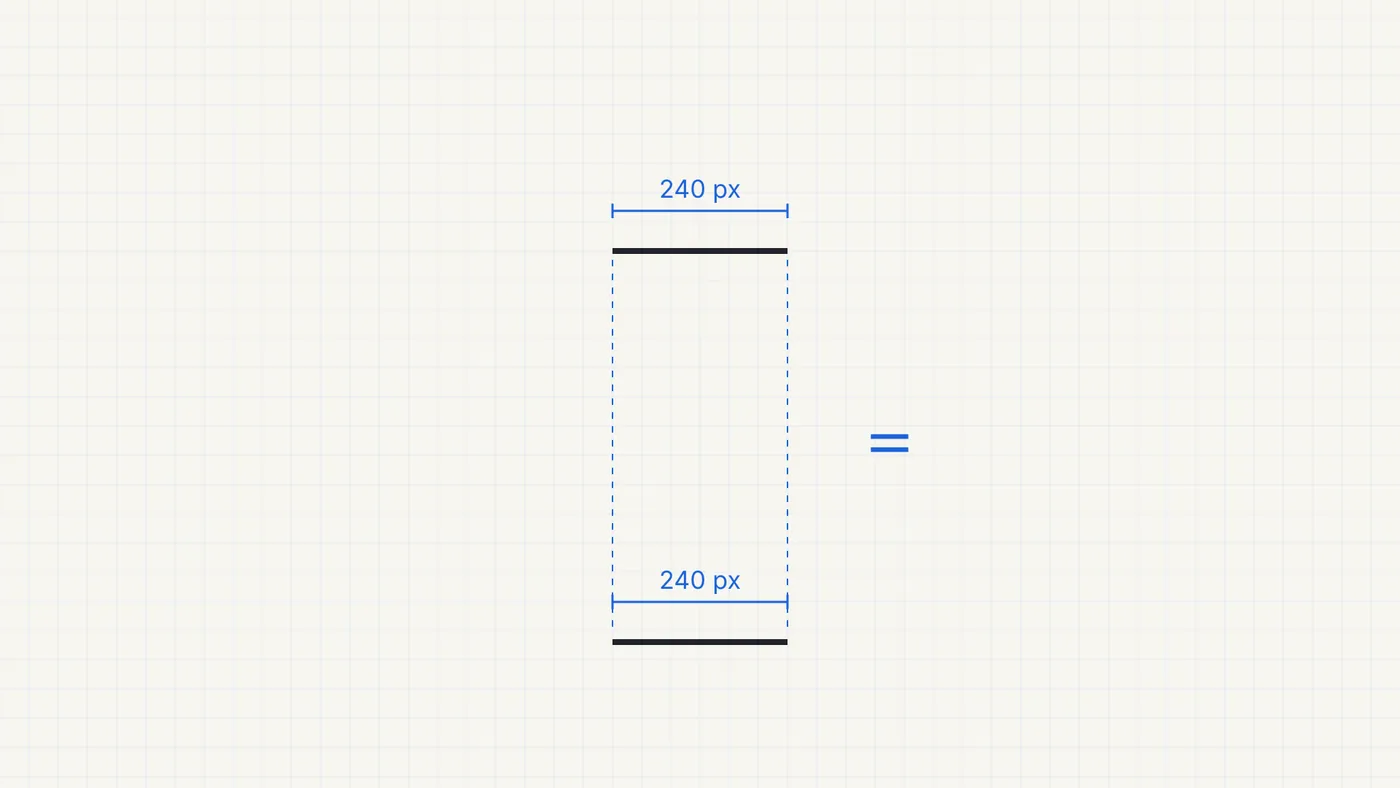
Both bars are 240 px long. Moving the upper one straight down by 536 px brings it onto the lower one. With the surroundings removed, the blue guides connect their matching endpoints.
Making the rails parallel gives the bars equal horizontal gaps to the rails: approximately 11.8 px on each side in this drawing. Does the apparent difference change? Only those side gaps have been matched; other relationships, such as distances to the ends of the rails, are not all identical.
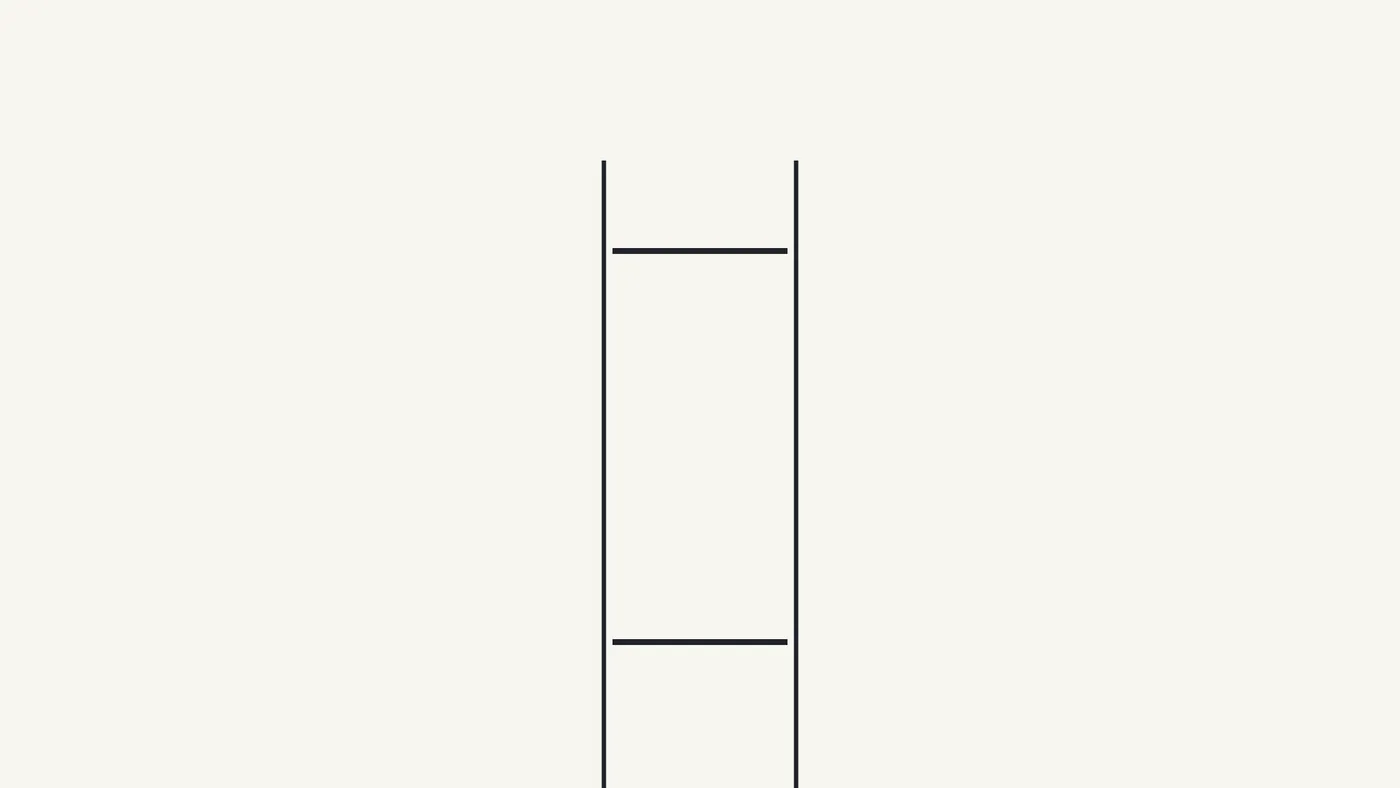
Three numbers that answer different questions
Floor lines, walls, a ceiling, light, and shade make the scene easier to read as a hallway. Does the far bar now look longer than it did with rails alone?
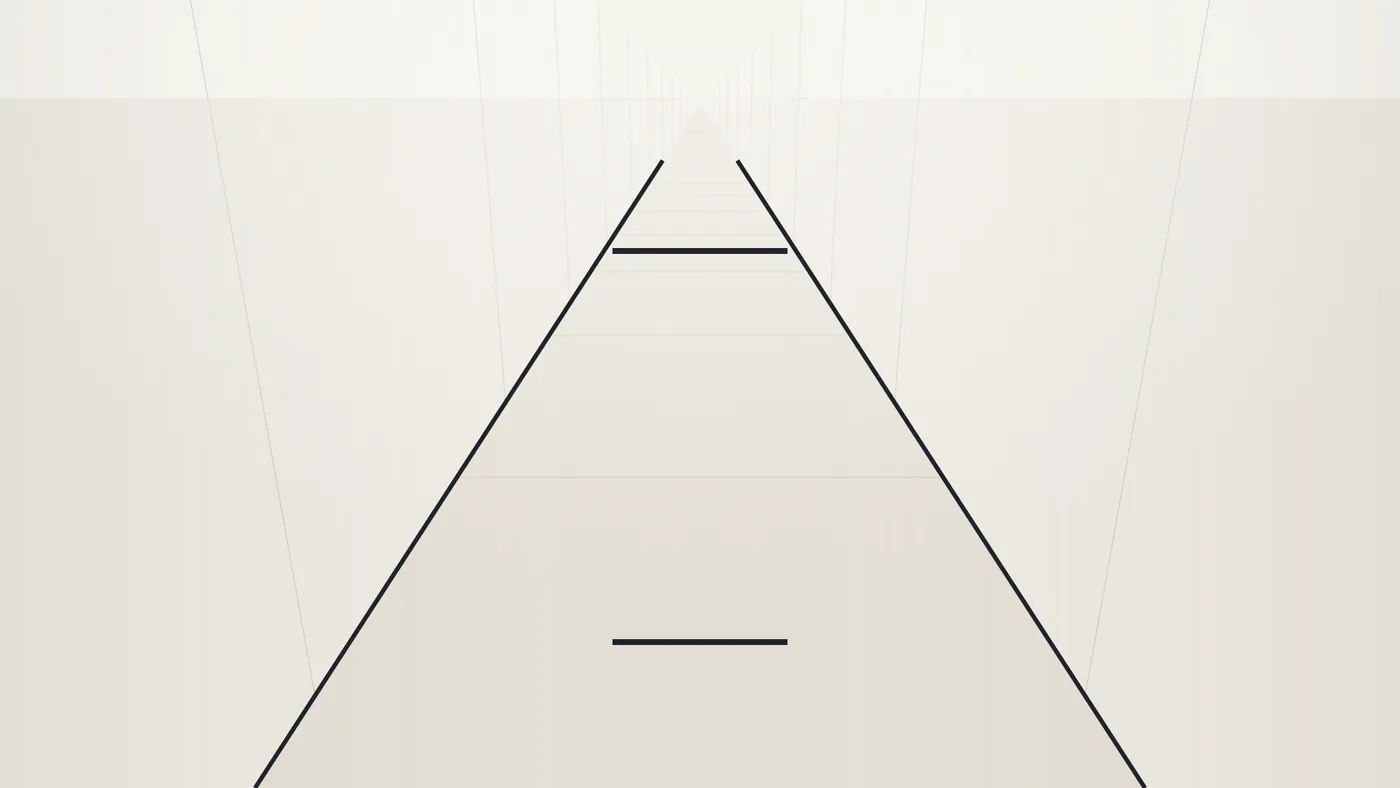
A depth account suggests that the processes used to interpret the size of distant objects also influence judgments of the drawn bars. We can explore that idea by asking how long the bars would be if they were real objects lying on this hallway floor.
| Position | Length in the original image | Implied physical length, approximately |
|---|---|---|
| Far | 240 px | 2.0 m |
| Near | 240 px | 0.55 m |
The far bar would be about 3.6 times as long. This is a geometric calculation using this picture's camera setup, including an eye height of 1.6 m and a hallway width of 2.2 m. It does not mean that viewers saw a 3.6-fold difference.
Murray, Boyaci, and Kersten (2006) measured a different quantity. They presented balls with equal on-screen diameters in a hallway picture and reported that the far ball's apparent diameter was at least 17% larger. That result concerns the perceived diameter of balls in their experiment. It is not a measurement of the illusion produced by our bars.
So 240 px describes our image, 3.6 describes a conditional physical-length ratio, and 17% describes a published perceptual result. They should not be substituted for one another.
Why the gaps still matter
The illusion also occurs in sparse rail-like drawings where depth is difficult to perceive. Landwehr (2023), among others, emphasizes the gaps between the bars and surrounding lines: a bar near the converging end is close to the rails, while a lower bar has more space around it.
Studies in which added depth cues strengthen the illusion support depth-based explanations. Yet they do not establish that sparse drawings and detailed hallways work through exactly the same mechanism. Yildiz and colleagues' 2022 review surveys both depth-based accounts and accounts that do not require perceived depth. Researchers still disagree about their relative contributions across different figures.
FAQ
Will knowing the lines are equal make the illusion disappear?
It may still look unequal. The Müller-Lyer illusion is often used in discussions of whether knowledge changes visual experience. However, Predebon (1998) found that continued inspection reduced the illusion in a Brentano version of the Müller-Lyer figure. Knowing the answer and repeatedly comparing the figure are different conditions. That result does not establish the same reduction for the vertical-horizontal and Ponzo illusions.
Is something wrong if I cannot see the illusion?
No. People differ, and the figure and viewing conditions matter. Equal-looking and unequal-looking responses are both worth checking. A larger or smaller mismatch is not better or worse, and this activity cannot diagnose intelligence, personality, health, or eyesight.
Are the lines on the lab bench always equal?
The opening question and experiments 1–3 use equal comparison lines. Measure, Puzzle, and Today's puzzle also use unequal lengths on purpose. Check the blue ruler for the current values. Its numbers use a 1000 × 1000 stage, so they are stage coordinates rather than screen-pixel counts or the video's image measurements.
Try your own match on the lab bench
Open the lab bench in this episode page's “Try it” section. Start with Ends, turning the fins until the figures look equal. In Direction, change how the lines meet. In Depth, add or remove the surroundings and drag the far bar toward the near one while its image length stays fixed.
Measure asks you to adjust a shaft until the two lengths look equal. You make six matches: two each at fin angles of 30°, 60°, and 90°. The result shows individual responses and their averages. At 90°, the figures have identical geometry, providing a comparison condition; a remaining mismatch includes ordinary variation in judging and adjusting the lines.
The measurement is not a diagnostic test. Perception varies between people, and there is no good or bad score. Stop whenever your eyes feel tired. Use the settings to find out how your own answer changes with the figure and the conditions.
Shorts
Sources
Where the facts and numbers in the video and on this page come from.
References
- Dewar (1967) Perceptual and Motor Skills 24:708–710
- Mamassian & de Montalembert (2010) Vision Research 50:956–962
- Mikellidou & Thompson (2013) Journal of Vision 13(8):7
- Howe & Purves (2005) PNAS 102:1234–1239
- Predebon (1998) Perception 27:183–192
- Chouinard, Peel & Landry (2017) Frontiers in Human Neuroscience 11:143
- Murray, Boyaci & Kersten (2006) Nature Neuroscience 9:429–434
- Yildiz, Sperandio, Kettle & Chouinard (2022) Psychonomic Bulletin & Review 29:293–320
- Landwehr (2023) Vision Research 202:108143
- Gatzia (2025) "Cognitive Penetrability", MIT Press Open Encyclopedia of Cognitive Science
Links
- Appalachian State University — Dewar paper (Dewar, R. E. (1967). Stimulus determinants of the magnitude of the Mueller-Lyer illusion. Perceptual and Motor Skills, 24, 708–710. Fin angle, length, and repeated judgments. Original publication as listed in Dewar's references: Müller-Lyer, F. C. (1889). Optische Urteilstäuschungen. Archiv für Physiologie, Supplement, 263–270)appstate.edu/~steelekm/classes/psy4215/Documents/Dew…
- Nature (Gregory, R. L. (1963). Distortion of visual space as inappropriate constancy scaling. Nature, 199, 678–680. Depth-based explanation)doi.org/10.1038/199678a0
- PubMed Central — US National Library of Medicine (Howe, C. Q., & Purves, D. (2005). The Müller-Lyer illusion explained by the statistics of image–source relationships. Proceedings of the National Academy of Sciences, 102(4), 1234–1239. Variants and existing explanations)pmc.ncbi.nlm.nih.gov/articles/PMC544622
- PubMed — US National Library of Medicine (Pressey, A., & Martin, N. S. (1990). The effects of varying fins in Müller-Lyer and Holding illusions. Psychological Research, 52, 46–53. Fin-induced position errors)pubmed.ncbi.nlm.nih.gov/2377725
- PubMed — US National Library of Medicine (Valerjev, P., & Dujmović, M. (2024). Measuring mislocalization of angle vertices. Canadian Journal of Experimental Psychology, 78(2), 88–99. Apparent vertex positions)pubmed.ncbi.nlm.nih.gov/38722576
- PubMed — US National Library of Medicine (Miyahara, E. (2006). Effects of chromaticities and occlusion of shaft on magnitude of the Müller-Lyer illusion. Perceptual and Motor Skills, 102(1), 259–264. Shaft and fin colors)pubmed.ncbi.nlm.nih.gov/16671627
- PubMed — US National Library of Medicine (Predebon, J. (1998). Decrement of the Brentano Müller-Lyer illusion as a function of inspection time. Perception, 27(2), 183–192. Reduced illusion after inspection)pubmed.ncbi.nlm.nih.gov/9709450
- PubMed — US National Library of Medicine (Mamassian, P., & de Montalembert, M. (2010). A simple model of the vertical-horizontal illusion. Vision Research, 50(10), 956–962. Orientation and bisection effects)pubmed.ncbi.nlm.nih.gov/20298713
- Journal of Vision (Mikellidou, K., & Thompson, P. (2013). The vertical-horizontal illusion: Assessing the contributions of anisotropy, abutting, and crossing to the misperception of simple line stimuli. Journal of Vision, 13(8), 7. Components of the junction effect)doi.org/10.1167/13.8.7
- Frontiers in Human Neuroscience (Chouinard, P. A., Peel, H. J., & Landry, O. (2017). Eye-Tracking Reveals that the Strength of the Vertical-Horizontal Illusion Increases as the Retinal Image Becomes More Stable with Fixation. Frontiers in Human Neuroscience, 11, 143. Orientation, framing, and individual variation. Earlier framing study discussed there: Künnapas, T. M. (1957). Vertical-horizontal illusion and surrounding field. Acta Psychologica, 13, 35–42)frontiersin.org/journals/human-neuroscience/articles/10…
- PubMed — US National Library of Medicine (Prinzmetal, W., & Gettleman, L. (1993). Vertical-horizontal illusion: One eye is better than two. Perception & Psychophysics, 53(1), 81–88. Monocular and binocular comparison)pubmed.ncbi.nlm.nih.gov/8433908
- University of Washington — Murray et al. paper (Murray, S. O., Boyaci, H., & Kersten, D. (2006). The representation of perceived angular size in human primary visual cortex. Nature Neuroscience, 9(3), 429–434. Apparent ball diameter in a hallway picture)courses.washington.edu/viscog/publications/Murray_NatNeurosci_…
- PubMed — US National Library of Medicine (Yildiz, G. Y., Sperandio, I., Kettle, C., & Chouinard, P. A. (2022). A review on various explanations of Ponzo-like illusions. Psychonomic Bulletin & Review, 29(2), 293–320. Review of depth-based and other accounts. Early work cited in that review: Ponzo, M. (1910). Intorno ad alcune illusioni nel campo delle sensazioni tattili, sullillusione di Aristotele e fenomeni analoghi. Leipzig: Wilhelm Engelmann. Original publication details are taken from the review)pubmed.ncbi.nlm.nih.gov/34613601
- PubMed — US National Library of Medicine (Landwehr, K. (2023). Deconfounded and mixed-symmetry versions of the Ponzo illusion figure. Vision Research, 202, 108143. Bar-to-context gaps)pubmed.ncbi.nlm.nih.gov/36347085
- MIT Press Open Encyclopedia of Cognitive Science (Gatzia, D. E. (2025). Cognitive Penetrability. Knowledge and visual experience)doi.org/10.21428/e2759450.e6f9bed3
- pubmed.ncbi.nlm.nih.gov/16059736
- pubmed.ncbi.nlm.nih.gov/11301517
- pubmed.ncbi.nlm.nih.gov/16893262
- publications.aston.ac.uk/id/eprint/44080/1/Schofield2022_VoR.pdf
- pubmed.ncbi.nlm.nih.gov/17775578
Voice, music, art
- Voice: Kokoro, Bella / Music: “さみしいおばけと東京の月” by しゃろう / “日曜の午後” by KK.