Car Production: Which Countries and Makers Lead? | Data in Motion #05
Short answer
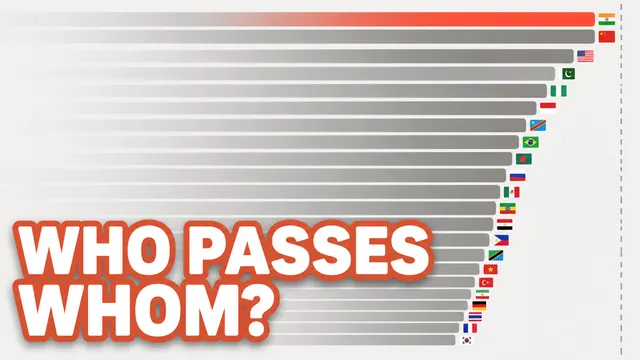
- The order keeps changing: we follow 8 countries from 1961 to 2025 and the top ten maker groups from 1999 as bars overtake each other.
- Country bars share one fixed 0–40 million scale, so you can watch Japan and the US change places as other bars grow or shrink.
- How we count matters: 2018 switches from OICA to industry tables with estimates, and mergers change maker totals without real growth.
Video

Pressing play loads the YouTube player on this page. Watch on YouTube
Explained
In the video
- 0:00Which countries build how many vehicles?
- 0:38What happens between annual records?
- 1:04Which cars sold well in each period?
- 1:16Who were the top ten makers in 1999?
- 2:12How do Japan and the US change places?
- 2:48What if some bars grow and others shrink?
- 3:29What about sales by model name?
- 4:02What do industry estimates add?
- 5:01Into 2025: where are Chinese makers?
- 5:14What does the light-vehicle list count?
- 5:30What is disclosed for the first half of 2026?
- 5:44Where does Nissan build its vehicles?
- 6:00Does the vehicle category change the order?
- 6:19How does the way we count change the picture?
Which countries and makers build the cars? Follow vehicle production as a continuous bar chart race, with hit cars alongside it.
Country chart data
Units: vehicles built in each calendar year, January–December. These selected snapshots show milestones and changes in order among the eight countries in the video; they are not a global top eight.
| Year | China | United States | Japan | India | South Korea | Mexico | Brazil | Spain |
|---|---|---|---|---|---|---|---|---|
| 1961 | — | 6,653,000 | 1,039,000 | 54,000 | — | — | 145,000 | 75,000 |
| 1971 | — | 10,672,000 | 5,811,000 | 89,000 | — | 211,000 | 516,000 | 532,000 |
| 1981 | — | 7,943,000 | 11,180,000 | 149,000 | 134,000 | 597,000 | 780,000 | 987,000 |
| 1991 | 709,000 | 8,790,000 | 13,245,000 | 355,000 | 1,498,000 | 989,000 | 960,000 | 2,082,000 |
| 1999 | 1,805,000 | 13,025,000 | 9,905,000 | 780,000 | 2,832,000 | 1,534,000 | 1,344,000 | 2,672,000 |
| 2000 | 2,009,000 | 12,774,000 | 10,145,000 | 796,000 | 3,115,000 | 1,923,000 | 1,671,000 | 3,033,000 |
| 2007 | 8,885,000 | 10,752,000 | 11,596,000 | 2,250,000 | 4,086,000 | 2,095,000 | 2,971,000 | 2,890,000 |
| 2008 | 9,233,000 | 8,672,000 | 11,564,000 | 2,316,000 | 3,827,000 | 2,168,000 | 3,220,000 | 2,542,000 |
| 2009 | 13,649,000 | 5,709,000 | 7,935,000 | 2,643,000 | 3,513,000 | 1,561,000 | 3,185,000 | 2,164,000 |
| 2010 | 18,265,000 | 7,743,000 | 9,626,000 | 3,554,000 | 4,272,000 | 2,342,000 | 3,648,000 | 2,388,000 |
| 2011 | 18,419,000 | 8,655,000 | 8,399,000 | 3,940,000 | 4,657,000 | 2,681,000 | 3,144,000 | 2,354,000 |
| 2017 | 29,015,434 | 11,189,985 | 9,693,746 | 4,782,896 | 4,114,913 | 4,068,415 | 2,699,672 | 2,848,335 |
| 2020 | 25,225,242 | 8,821,026 | 8,067,943 | 3,381,819 | 3,506,774 | 3,177,251 | 2,014,055 | 2,268,185 |
| 2023 | 30,160,966 | 10,639,140 | 8,998,538 | 5,852,143 | 4,243,597 | 4,001,964 | 2,324,838 | 2,451,243 |
| 2024 | 31,281,592 | 10,522,394 | 8,234,645 | 6,016,764 | 4,128,242 | 4,202,724 | 2,553,869 | 2,377,091 |
| 2025 | 34,530,738 | 10,243,844 | 8,410,232 | 6,490,810 | 4,102,200 | 4,092,448 | 2,644,054 | 2,274,026 |
“—” means unavailable, not zero. Older BTS values are rounded to thousands. From 2000, the definition assigns production to the country of final assembly. Published source figures can include estimates. Motion between records is display interpolation, not observed intermediate-year or monthly data. No forecasts are used here.
Manufacturer chart data, 1999–2024
Units: vehicles per calendar year. Selected snapshots show the top ten groups drawn from each year’s candidate list. OICA surveys through 2017 and industry tables/company disclosures from 2018 differ in method; the video does not interpolate across this break. Industry estimates can use shipment or sales proxies. Group boundaries and joint-venture allocations follow each year’s source, so changes do not solely measure output growth or decline. Hyundai and Kia are combined.
1999
| Rank | Group | Vehicles | Figure type |
|---|---|---|---|
| 1 | GM | 8,421,000 | OICA survey |
| 2 | Ford | 6,638,000 | OICA survey |
| 3 | Toyota | 5,462,000 | OICA survey |
| 4 | DaimlerChrysler | 4,828,000 | OICA survey |
| 5 | Volkswagen | 4,784,000 | OICA survey |
| 6 | Fiat / Iveco | 2,631,000 | OICA survey |
| 7 | PSA | 2,515,000 | OICA survey |
| 8 | Nissan | 2,455,000 | OICA survey |
| 9 | Honda | 2,425,000 | OICA survey |
| 10 | Renault | 2,347,000 | OICA survey |
2008
| Rank | Group | Vehicles | Figure type |
|---|---|---|---|
| 1 | Toyota | 9,237,780 | OICA survey |
| 2 | GM | 8,282,803 | OICA survey |
| 3 | Volkswagen | 6,437,414 | OICA survey |
| 4 | Ford | 5,407,000 | OICA survey |
| 5 | Hyundai–Kia | 4,172,461 | OICA survey |
| 6 | Honda | 3,912,700 | OICA survey |
| 7 | Nissan | 3,395,065 | OICA survey |
| 8 | PSA | 3,325,407 | OICA survey |
| 9 | Suzuki | 2,623,567 | OICA survey |
| 10 | Fiat / Iveco | 2,524,325 | OICA survey |
2011
| Rank | Group | Vehicles | Figure type |
|---|---|---|---|
| 1 | GM | 9,031,670 | OICA survey |
| 2 | Volkswagen | 8,525,573 | OICA survey |
| 3 | Toyota | 8,050,181 | OICA survey |
| 4 | Hyundai–Kia | 6,616,858 | OICA survey |
| 5 | Ford | 5,516,931 | OICA survey |
| 6 | Nissan | 4,631,673 | OICA survey |
| 7 | PSA | 3,582,410 | OICA survey |
| 8 | Honda | 2,909,016 | OICA survey |
| 9 | Renault | 2,825,089 | OICA survey |
| 10 | Suzuki | 2,725,899 | OICA survey |
2017
| Rank | Group | Vehicles | Figure type |
|---|---|---|---|
| 1 | Toyota | 10,466,051 | OICA survey |
| 2 | Volkswagen | 10,382,334 | OICA survey |
| 3 | Hyundai–Kia | 7,218,391 | OICA survey |
| 4 | GM | 6,856,880 | OICA survey |
| 5 | Ford | 6,386,818 | OICA survey |
| 6 | Nissan | 5,769,277 | OICA survey |
| 7 | Honda | 5,236,842 | OICA survey |
| 8 | Fiat Chrysler | 4,600,847 | OICA survey |
| 9 | Renault | 4,153,589 | OICA survey |
| 10 | PSA | 3,649,742 | OICA survey |
2018
| Rank | Group | Vehicles | Figure type |
|---|---|---|---|
| 1 | Volkswagen | 11,017,621 | Company production |
| 2 | Toyota | 10,569,303 | Company production |
| 3 | GM | 8,384,000 | Industry estimate |
| 4 | Hyundai–Kia | 7,275,000 | Industry estimate |
| 5 | Ford | 5,982,000 | Industry estimate |
| 6 | Nissan | 5,486,516 | Company production |
| 7 | Honda | 5,357,013 | Company production |
| 8 | Fiat Chrysler | 4,842,000 | Industry estimate |
| 9 | Renault | 4,120,000 | Industry estimate |
| 10 | PSA | 3,868,000 | Industry estimate |
2023
| Rank | Group | Vehicles | Figure type |
|---|---|---|---|
| 1 | Toyota | 11,517,622 | Company production |
| 2 | Volkswagen | 9,309,273 | Company production |
| 3 | Hyundai–Kia | 7,340,000 | Industry estimate |
| 4 | Stellantis | 6,393,000 | Industry estimate |
| 5 | GM | 5,886,000 | Industry estimate |
| 6 | Ford | 4,413,000 | Industry estimate |
| 7 | Honda | 4,188,039 | Company production |
| 8 | Nissan | 3,444,164 | Company production |
| 9 | Suzuki | 3,225,000 | Industry estimate |
| 10 | BYD | 3,045,000 | Industry estimate |
2024
| Rank | Group | Vehicles | Figure type |
|---|---|---|---|
| 1 | Toyota | 10,615,000 | Company production |
| 2 | Volkswagen | 8,953,693 | Company production |
| 3 | Hyundai–Kia | 7,231,000 | Industry estimate |
| 4 | Stellantis | 5,526,000 | Industry estimate |
| 5 | GM | 5,438,000 | Industry estimate |
| 6 | Ford | 4,470,000 | Industry estimate |
| 7 | BYD | 4,304,000 | Industry estimate |
| 8 | Honda | 3,727,513 | Company production |
| 9 | Geely | 3,337,000 | Industry estimate |
| 10 | Suzuki | 3,300,000 | Industry estimate |
PSA includes Peugeot and Citroën; FCA is Fiat Chrysler. Following their 2021 merger, the group is listed as Stellantis. Tesla is outside the top ten in this annual series and is tracked separately in the video.
| Year | Tesla vehicles | Figure type |
|---|---|---|
| 2017 | 101,027 | OICA survey |
| 2018 | 255,000 | Industry estimate |
| 2023 | 1,846,000 | Industry estimate |
| 2024 | 1,773,000 | Industry estimate |
The 2025 light-vehicle top ten
Production of passenger cars and light commercial vehicles, excluding heavy vehicles; weight limits vary by region. Values are approximate readings of the Frost & Sullivan chart on page 4, rounded to 100,000 vehicles. Small differences do not establish a precise rank. The 2024 column uses the same groups as the 2025 top ten, rather than a separate 2024 top ten. This is separate from the earlier all-vehicle series.
| Group | 2024 (approx. vehicles) | 2025 (approx. vehicles) |
|---|---|---|
| Toyota | 10,100,000 | 10,400,000 |
| Volkswagen | 8,500,000 | 8,200,000 |
| Hyundai–Kia | 7,000,000 | 7,000,000 |
| GM | 5,400,000 | 5,600,000 |
| Stellantis | 5,600,000 | 5,400,000 |
| BYD | 4,200,000 | 4,400,000 |
| Geely | 3,100,000 | 4,100,000 |
| Ford | 4,000,000 | 3,900,000 |
| Honda | 3,700,000 | 3,300,000 |
| Suzuki | 3,100,000 | 3,200,000 |
First half of 2026: seven groups with verified disclosures
Units: vehicles produced in January–June of each year, not full-year 2026 totals. This compares seven groups with verified disclosures, not the world’s top seven. Values use production, not sales or deliveries.
| Group | Jan–Jun 2025 (vehicles) | Jan–Jun 2026 (vehicles) |
|---|---|---|
| Toyota | 5,471,187 | 5,479,573 |
| Volkswagen | 4,519,000 | 4,171,000 |
| Suzuki | 1,650,943 | 1,886,585 |
| BYD | 2,137,033 | 1,814,130 |
| Honda | 1,736,381 | 1,679,637 |
| Nissan | 1,439,040 | 1,320,698 |
| Tesla | 772,859 | 860,144 |
Toyota includes Lexus and Daihatsu, excluding Hino in both years. VW figures are converted from reported thousands. BYD includes battery electric vehicles, plug-in hybrids and commercial vehicles; its disclosure is unaudited. Suzuki includes Japanese complete vehicles and assembly kits; overseas output excludes kits sent from Japan to avoid duplication. Other totals follow each company’s reporting scope.
Tesla totals sum Total Production for Q1 and Q2: 362,615 + 410,244 = 772,859 in 2025, and 408,386 + 451,758 = 860,144 in 2026. All four releases are linked below.
Data for the supplementary production charts
Nissan production by country (calendar year, vehicles)
These are five individually listed countries, not all Nissan production locations.
| Country | 2024 | 2025 |
|---|---|---|
| Japan | 656,990 | 565,444 |
| United States | 524,919 | 486,232 |
| Mexico | 669,941 | 658,536 |
| United Kingdom | 284,197 | 273,174 |
| China | 665,437 | 660,831 |
Jan–Mar 2026: four countries by vehicle category (vehicles)
These are the source’s vehicle categories, not occupations or actual uses. This quarter is separate from the full-year tables.
| Country | All vehicles | Passenger cars | Commercial vehicles |
|---|---|---|---|
| China | 7,039,187 | 5,908,720 | 1,130,467 |
| United States | 2,552,630 | 291,096 | 2,261,534 |
| Japan | 2,205,695 | 1,885,704 | 319,991 |
| India | 1,929,181 | 1,571,859 | 357,322 |
Honda and Subaru (calendar year 2025, vehicles)
| Manufacturer | Japan | Outside Japan | Worldwide |
|---|---|---|---|
| Honda | 689,802 | 2,706,255 | 3,396,057 |
| Subaru | 540,194 | 337,822 | 878,016 |
Three takeaways
- A country’s rank and a manufacturer’s rank measure different things; one maker can build vehicles in several countries.
- Leading groups change over time, while mergers and reporting changes also affect bar lengths.
- All-vehicle, light-vehicle and half-year figures cannot be combined into one ranking.
Sources
Where the facts and numbers in the video and on this page come from.
- Toyota: June 2026 results, January–June production for 2025 and 2026 (Retrieved 2026-10-15; link rechecked 2026-10-28)global.toyota/en/company/profile/production-sales-fig…
- Volkswagen: June 2026 results, January–June production for 2025 and 2026 (Retrieved 2026-10-15; link rechecked 2026-10-28)volkswagen-group.com/en/press-releases/volkswagen-group-stay…
- Suzuki: January–June 2025 production disclosure (June year-to-date figures) (Retrieved 2026-10-15; link rechecked 2026-10-28)globalsuzuki.com/globalnews/2025/0730a.html
- Suzuki: January–June 2026 production disclosure (June year-to-date figures) (Retrieved 2026-10-15; link rechecked 2026-10-28)globalsuzuki.com/globalnews/2026/0730.html
- BYD: June 2026 results, January–June production for 2025 and 2026 (Retrieved 2026-10-15; link rechecked 2026-10-28)www1.hkexnews.hk/listedco/listconews/sehk/2026/0701/2026…
- Honda: June 2026 results, January–June production for 2025 and 2026 (Retrieved 2026-10-15; link rechecked 2026-10-28)global.honda/en/newsroom/news/2026/c260730eng.html
- Nissan: June 2026 results, January–June production for 2025 and 2026 (Retrieved 2026-10-15; link rechecked 2026-10-28)nissan-global.com/JP/IR/PERFORMANCE/ASSETS/2026/PDF/Nissa…
- Tesla: Q1 2025, Total Production (Retrieved 2026-10-15; link rechecked 2026-10-28)ir.tesla.com/press-release/tesla-first-quarter-2025-…
- Tesla: Q2 2025, Total Production (Retrieved 2026-10-15; link rechecked 2026-10-28)ir.tesla.com/press-release/tesla-second-quarter-2025…
- Tesla: Q1 2026, Total Production (Retrieved 2026-10-15; link rechecked 2026-10-28)ir.tesla.com/press-release/tesla-first-quarter-2026-…
- Tesla: Q2 2026, Total Production (Retrieved 2026-10-15; link rechecked 2026-10-28)ir.tesla.com/press-release/tesla-second-quarter-2026…
- US Bureau of Transportation Statistics: National Transportation Statistics, world vehicle production (historical records) (Retrieved during production, 2026-10-13 to 2026-10-15)bts.gov/archive/publications/national_transport…
- OICA: annual country production statistics and Q1 2026 (Retrieved during production, 2026-10-13 to 2026-10-15)oica.net/production-statistics
- OICA: manufacturer production statistics, 1999–2017 editions (Retrieved during production, 2026-10-13 to 2026-10-15)oica.net/manufacturers-statistics
- CCFA: annual industry statistics for 2018–2024 manufacturer figures, including estimates (Retrieved during production, 2026-10-13 to 2026-10-15)ccfa.fr/analyse-statistiques
- Country production: source table including 2017 (Retrieved during production, 2026-10-13 to 2026-10-15)oica.net/wp-content/uploads/2025/11/By-country-2…
- Country production: source table including 2020 (Retrieved during production, 2026-10-13 to 2026-10-15)oica.net/wp-content/uploads/2025/11/By-country-r…
- Country production: source table including 2023 (Retrieved during production, 2026-10-13 to 2026-10-15)oica.net/wp-content/uploads/2025/11/prod-total-2…
- 1999 GM: annual source (Retrieved during production, 2026-10-13 to 2026-10-15)oica.net/wp-content/uploads/2007/06/cl99cons2.pdf
- 2008 Toyota: annual source (Retrieved during production, 2026-10-13 to 2026-10-15)oica.net/wp-content/uploads/2026/09/2008_toyota.…
- 2008 GM: annual source (Retrieved during production, 2026-10-13 to 2026-10-15)oica.net/wp-content/uploads/2026/09/2008_gm.pdf
- 2008 Volkswagen: annual source (Retrieved during production, 2026-10-13 to 2026-10-15)oica.net/wp-content/uploads/2026/09/2008_volkswa…
- 2008 Ford: annual source (Retrieved during production, 2026-10-13 to 2026-10-15)oica.net/wp-content/uploads/2026/09/2008_ford.pdf
- 2008 Hyundai–Kia: annual source (Retrieved during production, 2026-10-13 to 2026-10-15)oica.net/wp-content/uploads/2026/09/2008_hyundai…
- 2008 Honda: annual source (Retrieved during production, 2026-10-13 to 2026-10-15)oica.net/wp-content/uploads/2026/09/2008_honda.pdf
- 2008 Nissan: annual source (Retrieved during production, 2026-10-13 to 2026-10-15)oica.net/wp-content/uploads/2026/09/2008_nissan.…
- 2008 PSA: annual source (Retrieved during production, 2026-10-13 to 2026-10-15)oica.net/wp-content/uploads/2026/09/2008_psa.pdf
- 2008 Suzuki: annual source (Retrieved during production, 2026-10-13 to 2026-10-15)oica.net/wp-content/uploads/2026/09/2008_suzuki.…
- 2008 Fiat / Iveco: annual source (Retrieved during production, 2026-10-13 to 2026-10-15)oica.net/wp-content/uploads/2026/09/2008_fiat.pdf
- 2011 GM: annual source (Retrieved during production, 2026-10-13 to 2026-10-15)oica.net/wp-content/uploads/2026/09/2011_general…
- 2011 Volkswagen: annual source (Retrieved during production, 2026-10-13 to 2026-10-15)oica.net/wp-content/uploads/2026/09/2011_volkswa…
- 2011 Toyota: annual source (Retrieved during production, 2026-10-13 to 2026-10-15)oica.net/wp-content/uploads/2026/09/2011_toyota.…
- 2011 Hyundai–Kia: annual source (Retrieved during production, 2026-10-13 to 2026-10-15)oica.net/wp-content/uploads/2026/09/2011_hyundai…
- 2011 Ford: annual source (Retrieved during production, 2026-10-13 to 2026-10-15)oica.net/wp-content/uploads/2026/09/2011_ford.pdf
- 2011 Nissan: annual source (Retrieved during production, 2026-10-13 to 2026-10-15)oica.net/wp-content/uploads/2026/09/2011_nissan.…
- 2011 PSA: annual source (Retrieved during production, 2026-10-13 to 2026-10-15)oica.net/wp-content/uploads/2026/09/2011_psa.pdf
- 2011 Honda: annual source (Retrieved during production, 2026-10-13 to 2026-10-15)oica.net/wp-content/uploads/2026/09/2011_honda.pdf
- 2011 Renault: annual source (Retrieved during production, 2026-10-13 to 2026-10-15)oica.net/wp-content/uploads/2026/09/2011_renault…
- 2011 Suzuki: annual source (Retrieved during production, 2026-10-13 to 2026-10-15)oica.net/wp-content/uploads/2026/09/2011_suzuki.…
- 2017 Toyota: annual source (Retrieved during production, 2026-10-13 to 2026-10-15)oica.net/wp-content/uploads/2026/09/2017_Toyota.…
- 2017 Volkswagen: annual source (Retrieved during production, 2026-10-13 to 2026-10-15)oica.net/wp-content/uploads/2026/09/2017_Volkswa…
- 2017 Hyundai–Kia: annual source (Retrieved during production, 2026-10-13 to 2026-10-15)oica.net/wp-content/uploads/2026/09/2017_Hyundai…
- 2017 GM: annual source (Retrieved during production, 2026-10-13 to 2026-10-15)oica.net/wp-content/uploads/2026/09/2017_GM.pdf
- 2017 Ford: annual source (Retrieved during production, 2026-10-13 to 2026-10-15)oica.net/wp-content/uploads/2026/09/2017_Ford.pdf
- 2017 Nissan: annual source (Retrieved during production, 2026-10-13 to 2026-10-15)oica.net/wp-content/uploads/2026/09/2017_Nissan.…
- 2017 Honda: annual source (Retrieved during production, 2026-10-13 to 2026-10-15)oica.net/wp-content/uploads/2026/09/2017_Honda.pdf
- 2017 Fiat Chrysler: annual source (Retrieved during production, 2026-10-13 to 2026-10-15)oica.net/wp-content/uploads/2026/09/2017_Fiat.pdf
- 2017 Renault: annual source (Retrieved during production, 2026-10-13 to 2026-10-15)oica.net/wp-content/uploads/2026/09/2017_Renault…
- 2017 PSA: annual source (Retrieved during production, 2026-10-13 to 2026-10-15)oica.net/wp-content/uploads/2026/09/2017_PSA.pdf
- 2018 Volkswagen: annual source (Retrieved during production, 2026-10-13 to 2026-10-15)annualreport2018.volkswagenag.com/group-management-report/business-develo…
- 2018 Toyota: annual source (Retrieved during production, 2026-10-13 to 2026-10-15)global.toyota/en/company/profile/production-sales-fig…
- 2018 GM: annual source (Retrieved during production, 2026-10-13 to 2026-10-15)ccfa.fr/wp-content/uploads/2023/04/pdf_analyse_…
- 2018 Nissan: annual source (Retrieved during production, 2026-10-13 to 2026-10-15)nissan-global.com/JP/IR/PERFORMANCE/ASSETS/2018/PDF/Nissa…
- 2018 Honda: annual source (Retrieved during production, 2026-10-13 to 2026-10-15)global.honda/en/newsroom/news/2019/c190130ceng.html
- 2023 Volkswagen: annual source (Retrieved during production, 2026-10-13 to 2026-10-15)annualreport2023.volkswagen-group.com/group-management-report/business-develo…
- 2023 Hyundai–Kia: annual source (Retrieved during production, 2026-10-13 to 2026-10-15)ccfa.fr/wp-content/uploads/2026/05/CCFA-2025-FR…
- 2023 Honda: annual source (Retrieved during production, 2026-10-13 to 2026-10-15)global.honda/en/newsroom/news/2024/c240130eng.html
- 2023 Nissan: annual source (Retrieved during production, 2026-10-13 to 2026-10-15)nissan-global.com/JP/IR/PERFORMANCE/ASSETS/2023/PDF/Nissa…
- 2024 Volkswagen: annual source (Retrieved during production, 2026-10-13 to 2026-10-15)annualreport2024.volkswagen-group.com/group-management-report/business-develo…
- 2024 Honda: annual source (Retrieved during production, 2026-10-13 to 2026-10-15)global.honda/en/newsroom/news/2026/c260129eng.html
- 2017 Tesla: annual source (Retrieved during production, 2026-10-13 to 2026-10-15)oica.net/wp-content/uploads/2026/09/2017_Tesla.pdf
- 2018 Tesla: annual source (Retrieved during production, 2026-10-13 to 2026-10-15)ccfa.fr/wp-content/uploads/2023/04/pdf_analyse_…
- Frost & Sullivan: Automotive Production Trends and Insights, Global, 2026–2031 (April 2026), page 4 chart of 2024 and 2025 figures (Retrieved during production, 2026-10-13 to 2026-10-15)automotive.messefrankfurt.com/content/dam/messefrankfurt-redaktion/au…
- Nissan: December and full-year 2025 production, sales and exports (Retrieved during production, 2026-10-13 to 2026-10-15)global.nissannews.com/en/releases/nissan-production-sales-exp…
- Subaru: calendar year 2025 production (Retrieved during production, 2026-10-13 to 2026-10-15)subaru.co.jp/news-en/2026_01_29_153941
- Toyota logo: Toyota Motor Corporation, Wikimedia Commons (PD-textlogo).commons.wikimedia.org/wiki/File:Toyota_carlogo.svg
- CC BY 4.0.creativecommons.org/licenses/by/4.0
Voice, music, art
- Music (OpenTracks): “Sunrise” and “TALK and WALK” by かずち; “元気いっぱい!” by こばっと; “感動をあなたに” by Kyaai.
- Flags via flagcdn.com.