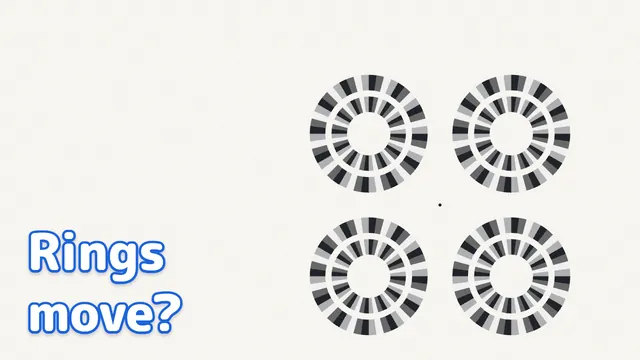
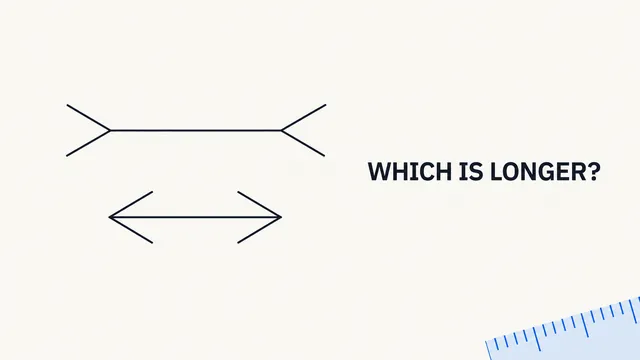
Which Patch Looks Lighter? Shadow & Stripe Optical Illusions, Tested | Illusion Lab #03
How it works
- Simultaneous contrast, the checker-shadow, and the Munker illusions make patches of one value look different.
- Covering the context or removing the stripes changes the look — shadow and stripes drive the effect.
- On the web page you can change the surrounds and stripe width, then save what you saw in an experiment note.
Video

Pressing play loads the YouTube player on this page. Watch on YouTube
Try it
Explained
In the video
- 0:00Do the first gray patches look the same?
- 0:16Can you trust the color you see?
- 1:23Does a shadow change the color?
- 1:45What if we cover the context?
- 2:54What does equal color mean?
- 3:27Do the stripes change the color?
- 3:47What if we remove only the stripes?
- 4:21Does stripe width matter?
- 5:39How do the first patches look now?
- 6:12Want to try it yourself?
Which center patch looks lighter to you? Compare the gray areas inside the dark and light surrounds before reading on. Then try the same question with a shadow, and a different question with colored stripes.
These three demonstrations explore the difference between an image's color data and the color you experience. They are simultaneous brightness contrast, the checker-shadow illusion, and the Munker illusion. You can take part whether the patches look different, equal, or hard to judge.
Simultaneous brightness contrast: remove the surrounds
A “patch” here means a small area of color. Compare the two gray patches in the centers of the larger squares, rather than the squares around them.

The patch in the dark surround can look lighter. Now compare the version with only the surrounds removed.
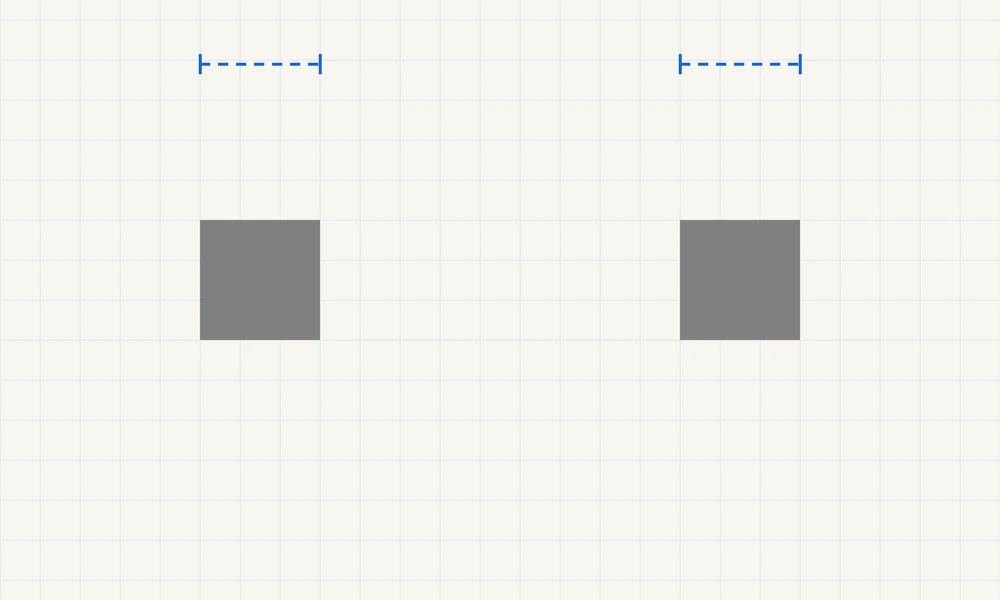
What is verified: both patches have source RGB values of 128 / 128 / 128. Their fill, position, and size stay fixed. The blue marks are checking guides; they do not recolor the patches.
This is simultaneous brightness contrast. “Contrast” describes a shift in appearance away from the surrounding lightness: a gray patch can look lighter against a dark area and darker against a light one.
Why does it happen, and what does that explanation leave open?
Comparisons with surrounding areas help explain the effect. But naming the direction of a change does not tell us exactly how the visual system produces it.
Pawan Sinha and colleagues' 2020 study provides evidence for processing at an early stage of vision. That evidence challenges explanations relying entirely on interpretations learned through visual experience. It does not justify saying that the retina alone explains the illusion, or that every shadow and color illusion has the same cause.
Removing our surrounds verifies a property of the diagram. It does not identify a particular neural circuit or establish how much each process contributes to your experience. The full details of the mechanism are still not known.
The checker-shadow illusion: compare outside and inside the shadow
Follow the gray arrows from the labels outside the board. A points to a dark square outside the shadow; B points to a light square inside it. Which looks lighter?
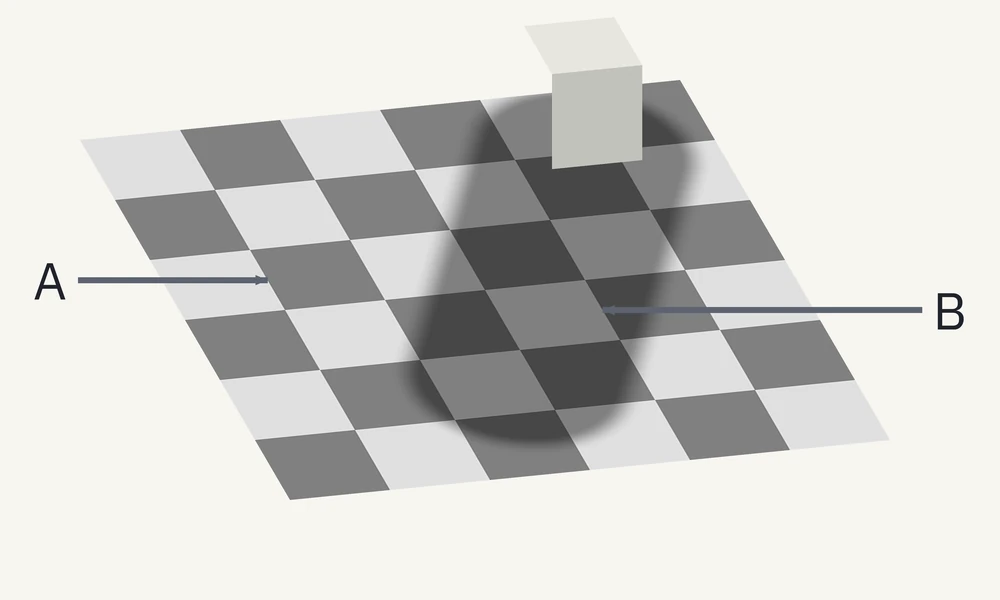
Keep your first impression in mind. In the next figure, the surrounding scene is covered while the two squares remain in place.
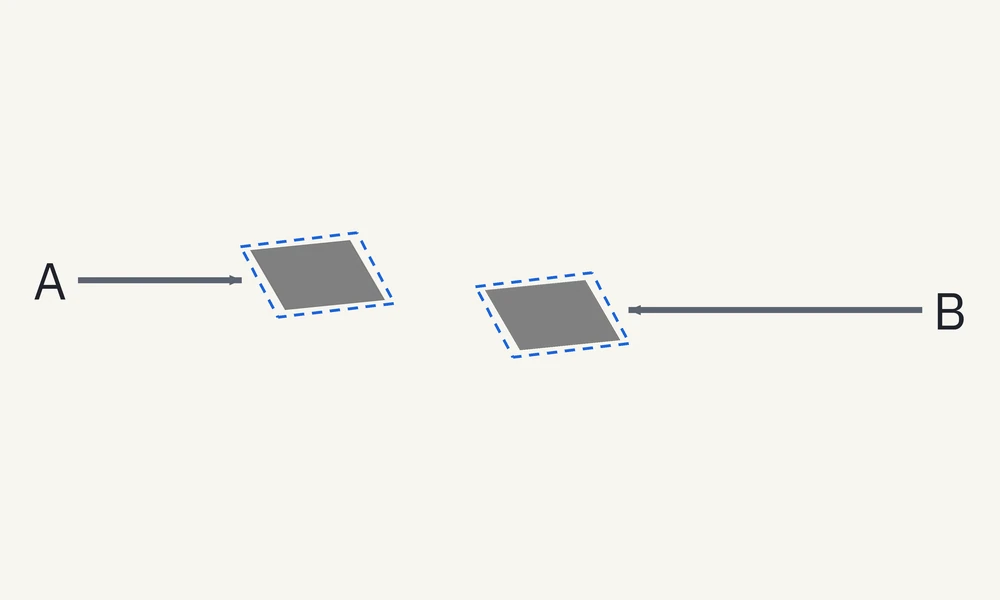
There is a second check. Restore the board, take a small patch copy from the center of each target square, and place the copies on a shared background below.
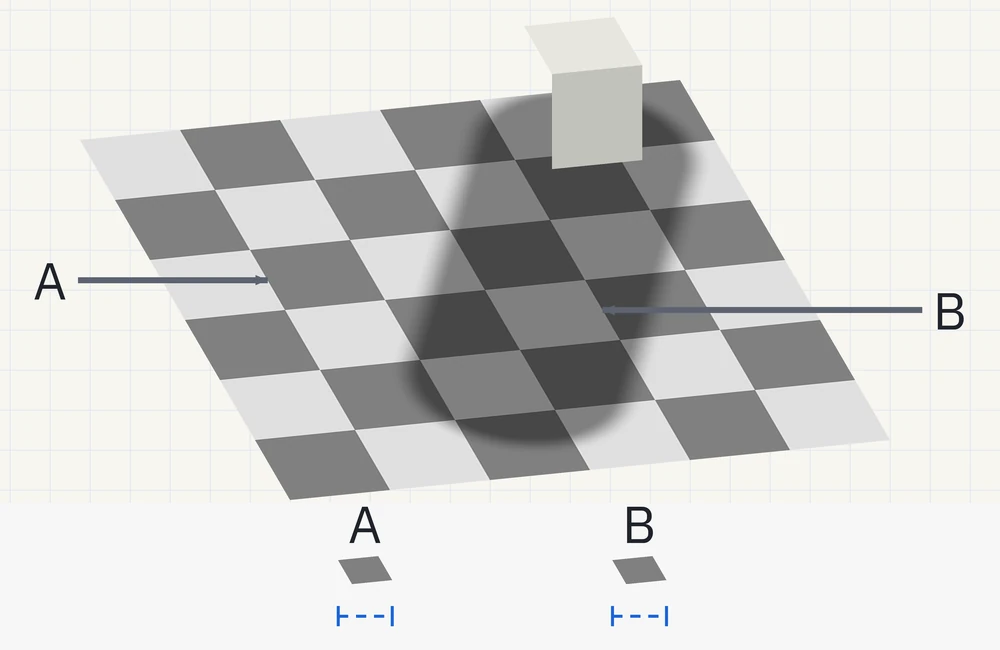
What is verified: squares A and B, and their copies, have source RGB values of 128 / 128 / 128. Each copy comes from the same-sized area. It is translated, without resizing or repainting. The production calculations also checked equality throughout the interiors of the two target squares, rather than at just one point.
This is an original diagram of the checker-shadow illusion associated with Edward H. Adelson. The episode draws on visual researcher Michael Bach's demonstration and explanation of Adelson's phenomenon.
Why does a square in shadow look lighter?
A white object can send less light toward us when it is in shadow, yet still look like a white object. In this diagram, neighboring squares and the soft shadow edge provide clues about illumination.
One account is that vision tries to separate a surface's color from the lighting on it. That helps explain why B can look like a lighter surface than A despite their matching image values.
Simply recognizing a shadow is not a complete explanation. Nearby comparisons also matter, and there are several ways to model the roles of lighting, shape, and surrounding structure. Removing the block alone is not a decisive test: the shadow and checkerboard remain available as clues.
A supplementary study by P. George Lovell, Kenneth C. Scott-Brown, and Ioan E. Smart (2026) concerns a different checker-block illusion. Its numerical results and the relative contributions of its cues should not be transferred to this flat checker-shadow diagram. Whether one account fully explains the appearance of our diagram remains unsettled.
The Munker illusion: look between the stripes
This time, compare hue—the color quality, rather than just how light or dark something looks. Look at the exposed parts of the left and right patches, not the purple and green stripes themselves.
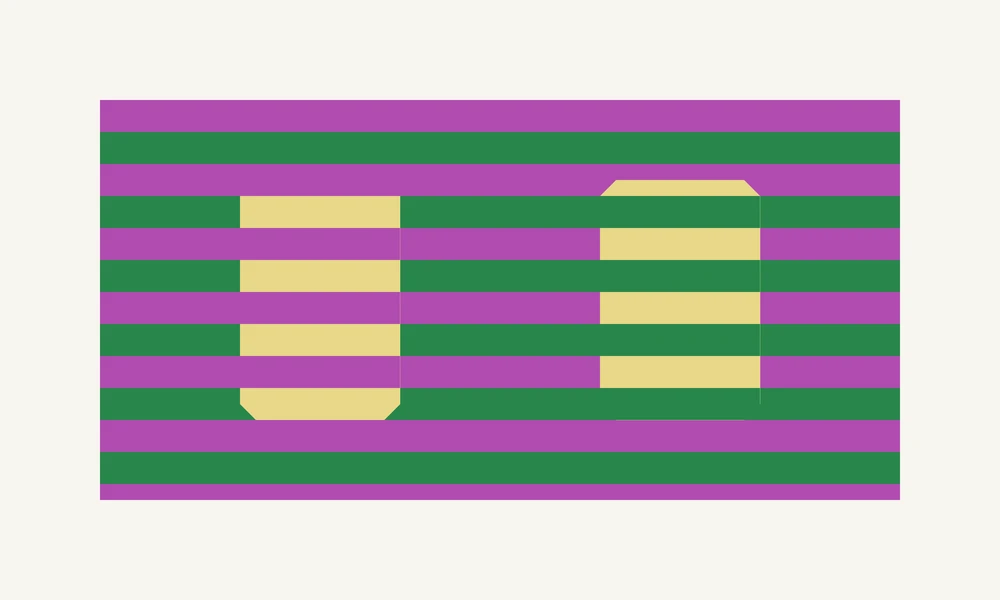
In the checking version, both the foreground and background stripes are removed. The patches underneath keep their original fill and shape.
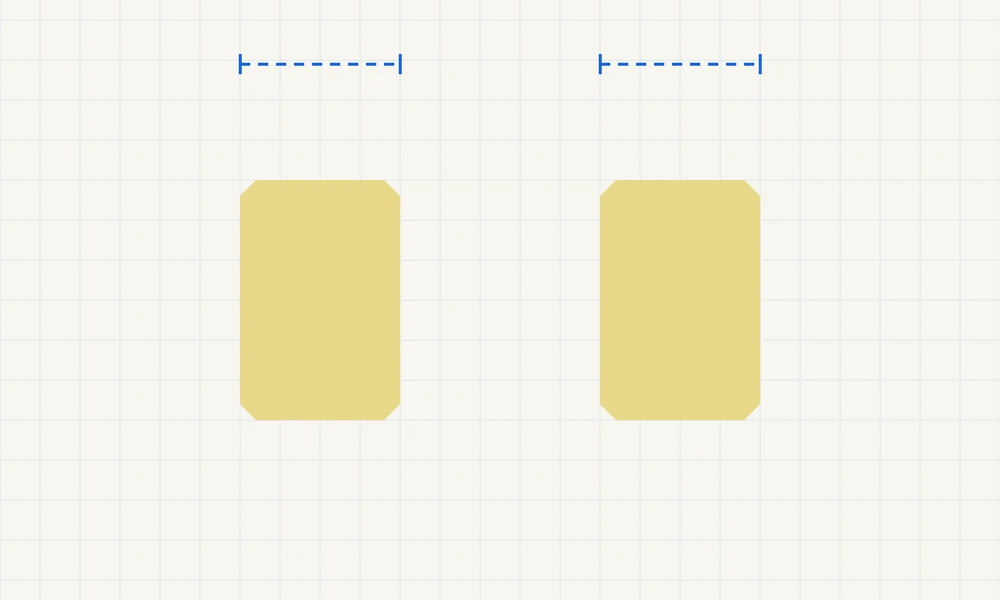
What is verified: the exposed patch areas on both sides have source RGB values of 232 / 216 / 136. The matching data belong to the base patches. The entire regions containing patches and stripes are different images.
This is the Munker illusion, with references tracing back to Munker's 1970 work. Our explanations use Bach's account, Akiyoshi Kitaoka's 2015 research presentation, and David Novick and Akiyoshi Kitaoka's 2021 paper. We do not present the original 1970 work as a paper directly read for this episode. The hue effect shown here is also distinguished from the achromatic Munker–White effect, which concerns shifts in lightness.
Why do the colors shift? Assimilation and contrast
“Assimilation” means an apparent shift toward surrounding colors. “Contrast” means a shift away from them. Novick and Kitaoka describe the Munker illusion in terms of both effects.
The arrangement matters: which colors touch the exposed patch areas, and how closely the stripes are spaced in your view. Averaging the stripe colors is not a complete recipe for predicting what a person will see. The detailed mechanism, including which neighboring information contributes over which area, is still not fully understood.
What “the same color” means here
RGB specifies red, green, and blue values. All the numbers below are source diagram values. Matching values within the diagram do not guarantee matching emitted light on different displays, and they do not establish the color of any real paint.
| Target being compared | Left / A RGB | Right / B RGB | Size in the original design |
|---|---|---|---|
| Simultaneous-contrast patches | 128 / 128 / 128 | 128 / 128 / 128 | Each 120 × 120 |
| Patch samples from the shadow scene | 128 / 128 / 128 | 128 / 128 / 128 | Each sampled from a 40 × 40 area on the board |
| Base patches underneath the stripes | 232 / 216 / 136 | 232 / 216 / 136 | Each 160 wide × 240 high, with matching clipped corners |
These sizes use internal drawing units on a 1000 × 600 stage. They are not screen pixels or physical measurements in millimeters. The shadow samples are measured on the board before it is drawn at a slant; the board has 6 × 6 squares, each originally 100 × 100. Both sides use the same scale when the figures are displayed at a different size.
Boundaries, where neighboring colors can blend during rendering, are excluded from checks of the patches' base values. Image data, display output, and perceived appearance are distinct things to consider.
Change one condition and compare again
Reduce the difference between the surrounds
The initial dark surround is RGB 48 / 48 / 48; the light surround is RGB 224 / 224 / 224. At the minimum setting on the experiment bench, both surrounds become RGB 128 / 128 / 128, matching the unchanged patches.
That is a different operation from removing the surrounds to reveal paper. Try one operation at a time, then return to viewing and compare how the patches look.
Cover the shadow scene or remove only the block
In the Shadow experiment, you can change how much context is hidden and whether the block is shown. Compare those operations separately. This experiment keeps the target squares fixed; it does not darken the shadow and thereby change B's own value.
Change stripe width and viewing size
The finished episode starts with a stripe width of 32 internal units and a repeating purple–green pair of 64 units. The web control offers widths from 12 to 32 in steps of 2. Its setting positions are not scores for illusion strength.
Novick and Kitaoka explain that increasing stripe separation in the visual field too far can weaken assimilation, while making the pattern excessively fine approaches simple spatial color mixing. This does not fit a rule that ever-narrower stripes must always produce a stronger illusion. The transition depends on viewing size, display, and observer; this episode has not measured a universal cutoff.
“Show detail” enlarges a 72 × 72 area from each side by the same factor of 3. With the original diagram still visible, you can inspect where stripes touch each patch. This is a view of the pattern, not a measurement of how strongly you experience it.
FAQ
Does equal RGB always mean equal-looking color?
No. Within one diagram, matching source values can look different because of surrounding light and dark areas, shadows, or colored stripes. Equality in the image data does not require everyone to have the same visual experience.
Why can the illusion remain after I know the answer?
Knowing the values and experiencing the appearance are separate things. The patches may still look different, or they may look equal. Record what you see now instead of trying to reproduce the answer you learned. This demonstration does not settle the detailed mechanisms by which knowledge affects appearance.
Are the two striped regions identical images?
No. What matches is the base fill of the patches and the values exposed between the stripes. Different stripe colors cross in front of them. Equality of the patches does not imply equality of the whole striped regions.
Does failing to see an illusion indicate an eyesight problem?
This experiment cannot support that conclusion. People experience these diagrams differently, and display and viewing size can affect appearance. “Looks equal” and “Unsure” are valid observations to save. These notes are not a diagnosis or a test of eyesight, health, or personality.
Try the color experiment bench
Use this page's “Try it” section, or choose “Open full screen” for more room. Start with Light and dark, compare the gray patches, then select “Remove the context to check.”
- Select “Return to viewing” and change one condition.
- Try Shadow and Stripes, comparing first and checking afterward.
- Choose “Note this setup” to save “Looks different,” “Looks equal,” or “Unsure,” with an optional note.
- Reopen a saved setup with “Open this setup.” If the diagram size differs from your earlier note, take that change in conditions into account.
People can experience these differently. The bench does not measure color matches or assign an illusion-strength score. Notes describe appearance; they are not diagnostic measurements. Saved notes remain on your device and are not sent to an outside server by the page's recording function.
Return to the first pair once more. With a way to check the values, what words would you now use for what you see?
Shorts
Sources
Where the facts and numbers in the video and on this page come from.
- MIT, Sinha Lab (Pawan Sinha et al. (2020). Mechanisms underlying simultaneous brightness contrast: Early and innate. Vision Research, 173, 41–49. Evidence for early visual processing. Bibliographic record and abstract also available from)web.mit.edu/sinhalab/Papers/Brightness_VR2020.pdf
- PubMedpubmed.ncbi.nlm.nih.gov/32464426
- Michael Bach (Adelson's Checker-shadow illusion. A researcher's demonstration and explanation of Edward H. Adelson's phenomenon, including context removal and the distinction between surface properties and illumination)michaelbach.de/ot/lum-adelsonCheckShadow
- Akiyoshi Kitaoka, Ritsumeikan University—author-hosted paper (David Novick & Akiyoshi Kitaoka (2021). The confetti illusion. Journal of Illusion, 2:6152. Pages 2–3 discuss the Munker illusion, assimilation, contrast, and stripe spacing; pages 6–7 contain discussion of open questions)psy.ritsumei.ac.jp/akitaoka/confetti_illusion-JOI2021-6152…
- Michael Bach (Munker Illusion. A researcher's demonstration and explanation, including a reference to Munker's 1970 work. The original work is not presented here as directly consulted)michaelbach.de/ot/col-Munker
- Akiyoshi Kitaoka, Ritsumeikan University(Kitaoka (2015). 乗算的および加算的色変換による色の錯視)psy.ritsumei.ac.jp/akitaoka/sakkakuWS2015.html
- PubMed Central (P. George Lovell, Kenneth C. Scott-Brown & Ioan E. Smart (2026). Understanding the image cues driving the switch from brightness to lightness responses in the Adelson checker-block illusion. Supplementary research on a different checker-block display; its numerical results are not transferred to this episode's diagram)pmc.ncbi.nlm.nih.gov/articles/PMC12876641
- W3C (CSS Color Module Level 4—Sample code for Color Conversions. A reference for linearizing sRGB values and converting them back when constructing the shadow diagram, not a model of human perception)w3.org/TR/css-color-4
Voice, music, art
- Sound effects: Kenney Interface Sounds (CC0). Quiet room tone by Tamelabo.
- Fonts: IBM Plex Sans JP, IBM Plex Sans, Inter (SIL Open Font License).